Table of Contents
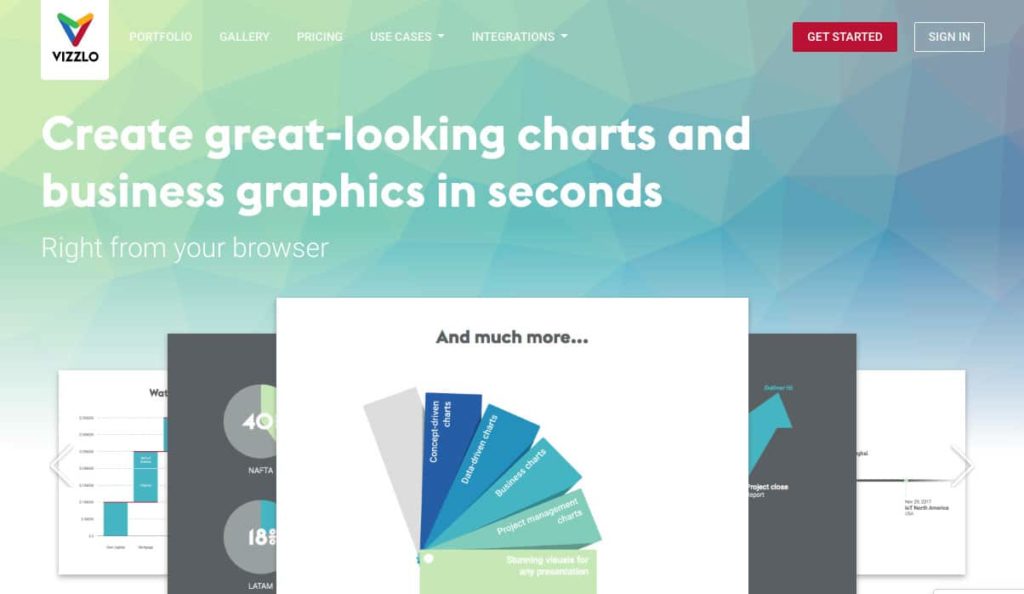
Vizzlo is an easy and elegant data visualization platform that increases productivity by providing users with extremely intuitive online tools to create designer-grade charts and diagrams in no time.
Vizzlo has over 75 template graphics for you to choose from, covering everything from Venn diagrams to milestone charts, timelines, maps and process diagrams.
It also has Gantt charts and waterfall diagrams. I don’t use these as a replacement for my trusted project management tools for scheduling, but it is useful to do a Gantt chart summary for stakeholders who won’t understand a 1000-line MS Project plan.
Choose what you want to create. It’s not an unlimited choice, there are enough templates to create slides for presentations or other communications. The company regularly adds more designs. There are some good graphics specifically for startups and also project teams, so you will find something that meets your needs.
Overall Vizzlo has a sleek and professional looking program that is usable directly from a browser. From Gantt charts to circular agendas, feedback loops to road maps, Vizzlo is the program to use if you seek to create simple yet effective graphic elements. Vizzlo is easy to use and can customize almost every option within the given templates.
Vizzlo create great-looking charts and
business graphics in seconds