Apple SWOT analysis uncovers some of the big challenges Apple faces in 2024 and beyond. One big issue though can’t be ignored.
Apple is a US-based consumer electronic company that has an estimated worth of over a trillion dollars. Equally impressive, is how Apple has retained the top slot of being the number one brand in the world for several consecutive years.
Apple though is at a pivotal point in its history. Competition is now fierce and Apple’s growth is stalling.
There’s a lot to love about Apple, its history iconic leaders and pioneering design. But let’s face it, others have caught up.
Apple is now looking quite exposed with over 50% of revenue from a single product line which is facing fierce competition, particularly from Asia. Is Apple is in jeopardy of following in the footsteps of Nokia?
Table of Contents
Apple Quick Facts
Apple Products and Services
Apple Competitors
Apple SWOT Analysis
Part of any SWOT requires is an analysis of the company’s financial performance, market and the Apple business model.
In this Apple SWOT analysis, I’ll take a look into the external challenges Apple faces – the Opportunities and Threats, as well as its internal capabilities to realize the opportunities and deal with the threats – Strengths and Weaknesses.
What is the SWOT analysis For Apple?
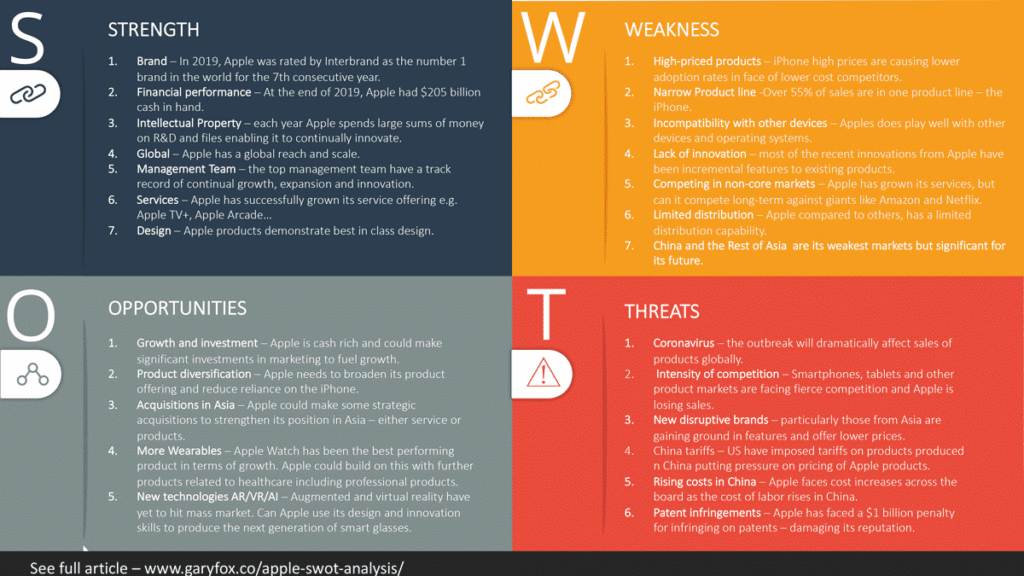
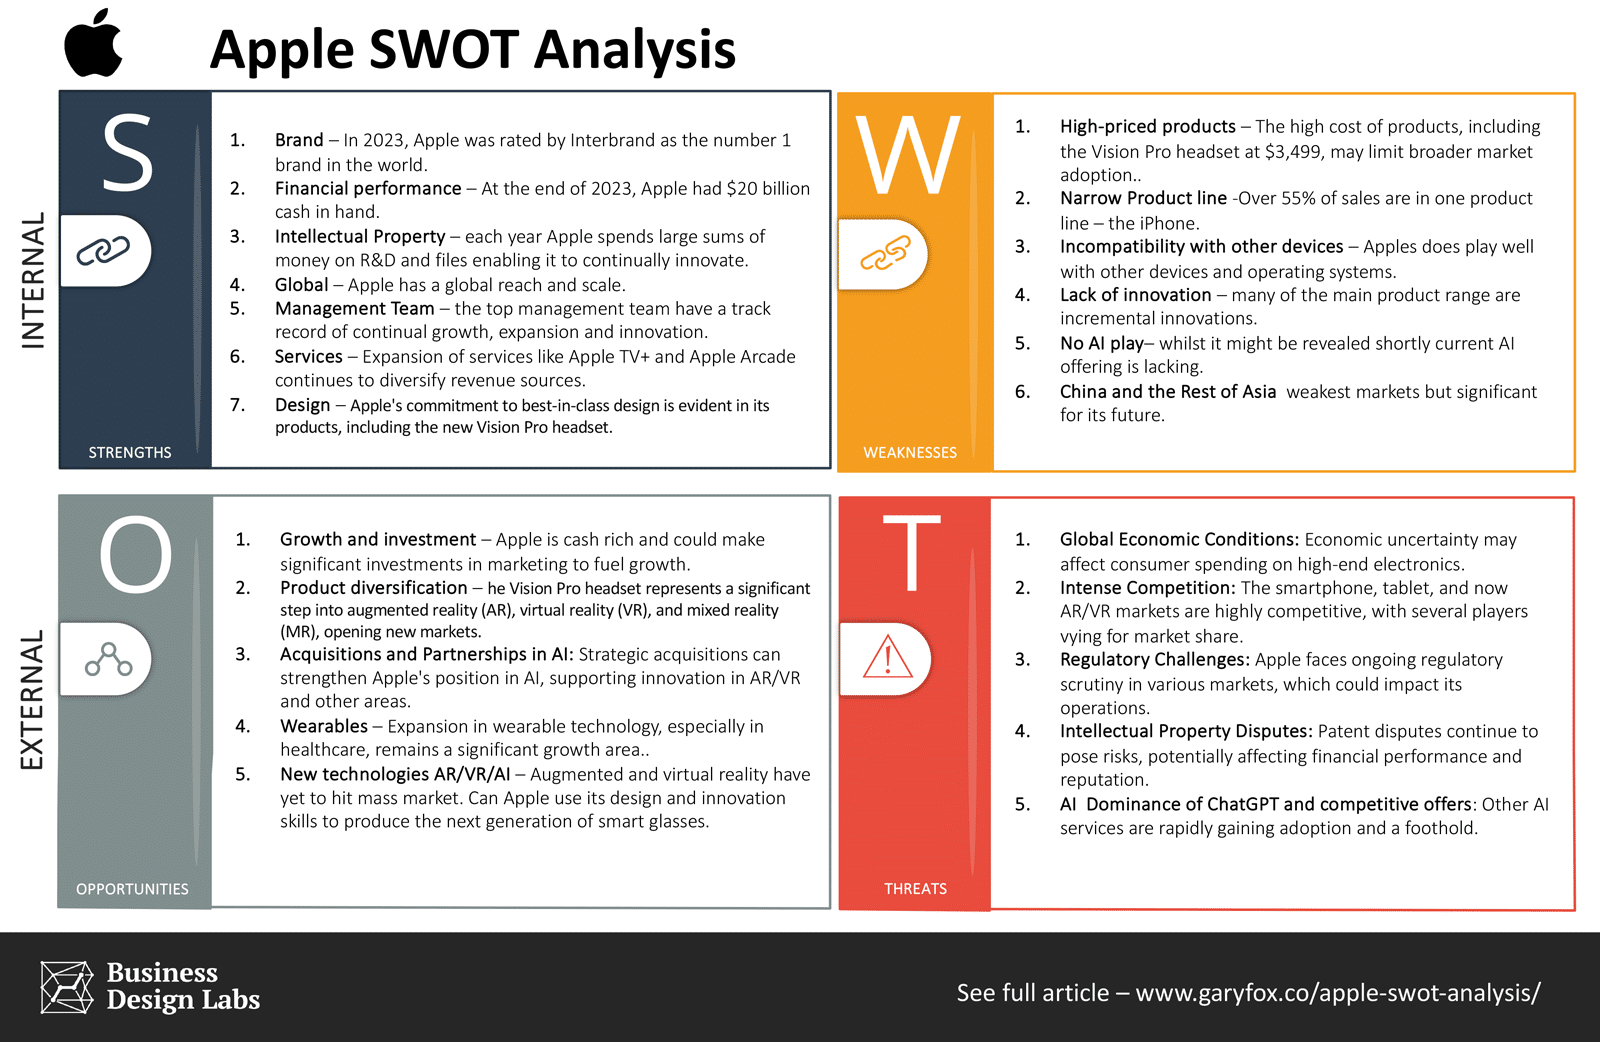
The SWOT analysis of Apple analyses the internal capabilities of Apple (strengths and weaknesses) as well as the external environment (opportunities and threats). The result shows Apple is at a pivotal point in its history.
Financial Analysis of Apple
To see the full breakdown of Apple’s financial results.
The following table presents the revenue and gross margin (as a proxy for profitability since net profit by line is not provided) for Apple Inc.’s product and service lines for FY 2023:
| Product/Service Line | Revenue ($ Billion) | Gross Margin ($ Billion) | Gross Margin Percentage |
|---|---|---|---|
| iPhone | 200.6 | N/A | N/A |
| Mac | 29.4 | N/A | N/A |
| iPad | 28.3 | N/A | N/A |
| Wearables, Home and Accessories | 39.8 | N/A | N/A |
| Services | 85.2 | 60.3 | 70.8% |
| Total (Products & Services) | 383.3 | 169.1 | 44.1% |
- Products Gross Margin: For products (iPhone, Mac, iPad, Wearables, Home and Accessories), the specific gross margin is not discretely listed, but the overall products gross margin was $108.8 billion.
- Services Gross Margin: The services gross margin was $60.3 billion, with a gross margin percentage of 70.8%.
- Overall Gross Margin: The total gross margin for Apple Inc. across all products and services was $169.1 billion for the fiscal year 2023, with an overall gross margin percentage of 44.1%
Apple’s Strengths

Apple’s Weaknesses
Apple’s Opportunities
Apple’s Threats
The Apple SWOT Analysis

Free SWOT Analysis Templates
If you’re interested in creating your own SWOT analysis then download these free SWOT analysis templates now.


