Looking for the latest social media statistics? Do you want to find out which social media site is right for your brand?
It doesn’t matter whether you’re building a presentation, a pitch, or you’re just plain curious, these social media statistics will help you gather the details you need.
All the data here is regularly updated, but I will generate a new post each year.
Based on the statistics, I’ve also ranked each social media network based on the data.
Bonus: Grab the full infographic at the bottom of this post to share on your site!


Top insights – with the move to video and with an increasing focus on Influencer Marketing, platforms such as TikTok are grabbing market share.
Here are the 11 most popular genres:
- Ask Me Anything Videos
- Behind the Scenes Videos
- Challenge Videos
- Educational Videos
- Explainer Videos
- Funny Videos/Comedy Videos
- Product Demo/Launch Videos
- Product Reviews
- Reaction Videos
- Video Podcasts
- Music Videos
- Vlogs
- Video Tutorials
The other trend is the continued growth of messaging apps and stories that are set to continue. WhatsApp and Facebook messenger both show strong growth.
Table of Contents
Global Social Media Statistics
The United Nations estimates the global population at 8.20 billion. That is 70 million more than a year ago, a rise of 0.9 percent. About 4.8 billion people, or 58.1 percent, live in cities, while roughly 3.4 billion live in rural areas.
The world of social media is fast-paced, and it changes rapidly. To keep up with the continuously evolving social media space, here are some general social media statistics to get you up to speed.
Social media is still dominated by the top social networks and Facebook in particular. Apps like Snapchat, Twitch, and Tiktok may get a lot of press.

How Many People Use Social Media?
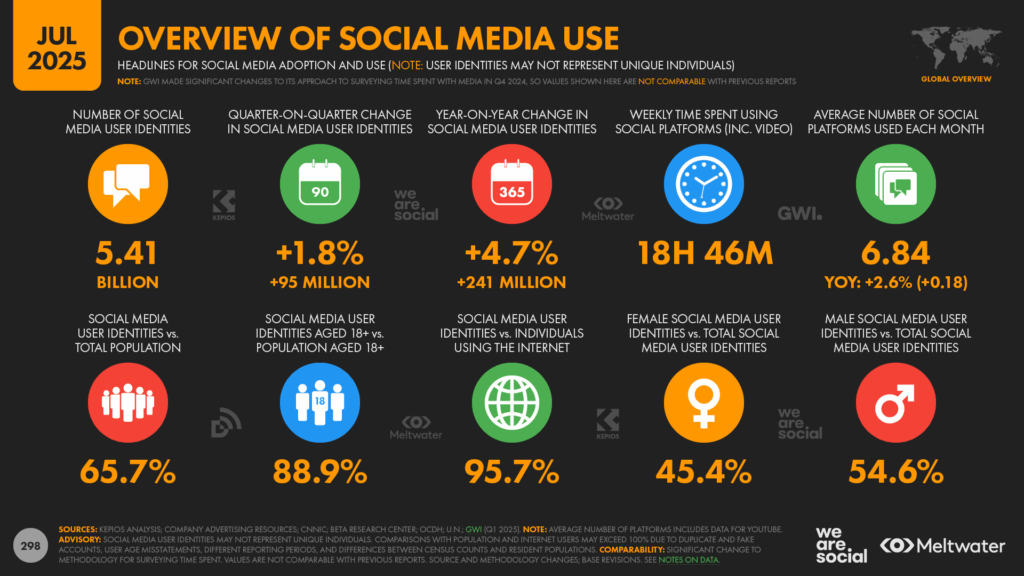
- 5.41 billion social media users around the world at the start of July 2025, equating to 65.7 percent of the total global population. Close to 100% use mobile to access social media platforms. – Source: Datareportal.
- As of July 2025 mobile devices account for nearly 64% of global web traffic – Source: Market.us.
How Much Time Is Spent On Social Media?
Global Monthly Active Users by Platform
If you find anything in this article that is outdated or inaccurate and you can provide a credible source, please let me know in the comments section.
So now let’s take a look at the figures.
1. Facebook Statistics
India is the country with the most Facebook users
Facebook was founded by Mark Zuckerberg and launched in 2004. During its creation, Facebook was only initially limited to Harvard students. However, as it became popular it was promoted to other Universities and then to anyone over 13 years old.
India has more accounts than any other country in the world with over 378 million users. The United States has the second-highest number of Facebook users at 193 million. (Indonesia, Brazil, and Mexico follow.)
Facebook Demographics Statistics
Facebook Usage Statistics
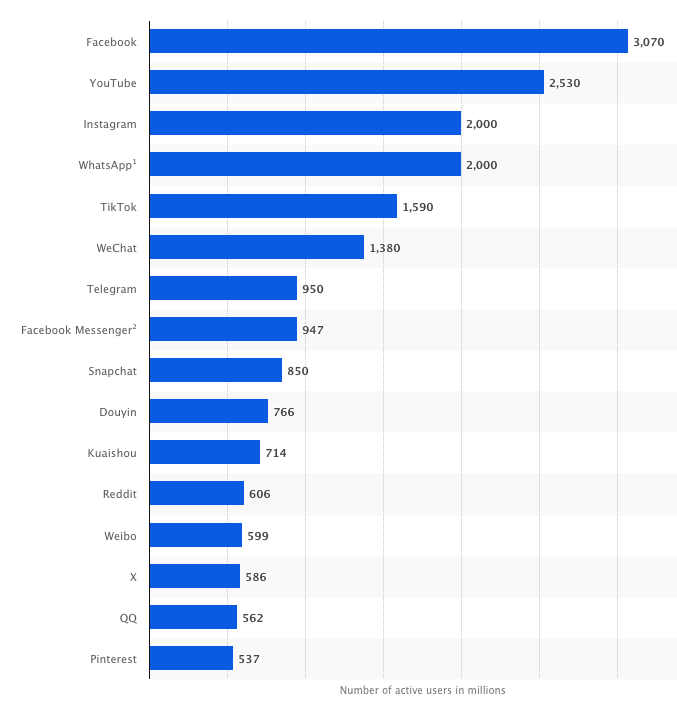
- Facebook has 3.07 billion monthly active users (MAU).
- The platform has 2.11 billion daily active users (DAU), representing 68.72% of its monthly active user base.
- India boasts the largest Facebook audience, with 581.6 million users, followed by the United States, which has 279.8 million users.
- In 2023, Facebook recorded an impressive 553 million downloads.
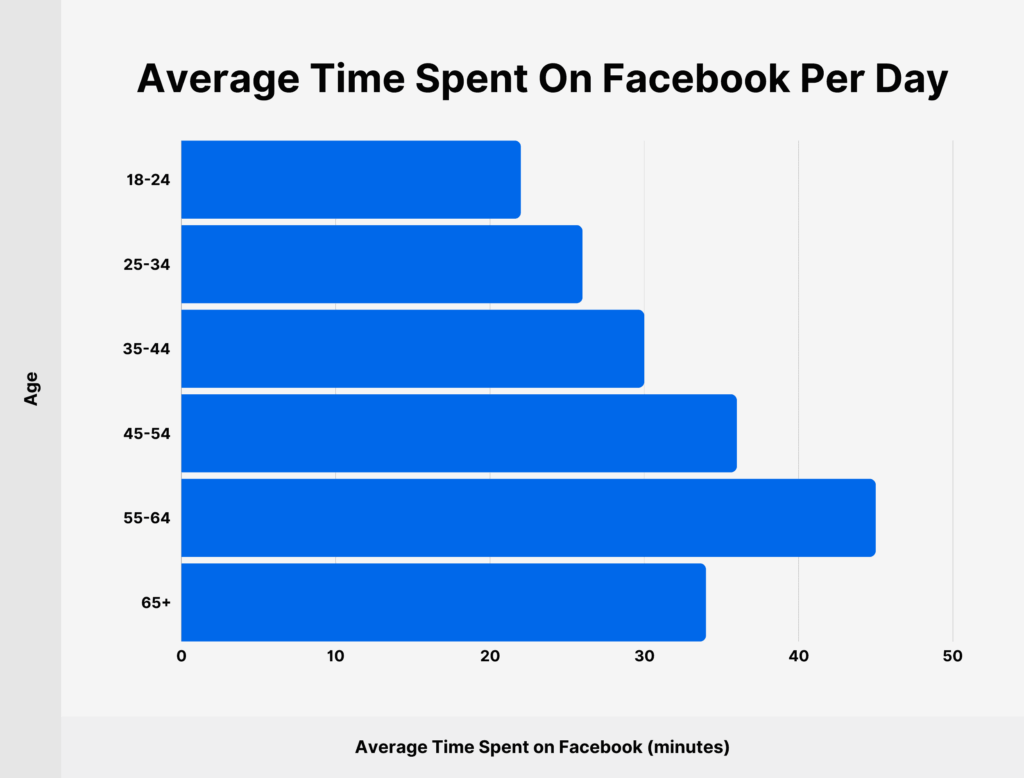
- On average, a user spends approximately 10 minutes and 12 seconds on Facebook.
- 55.26% of Facebook users are male, while 44.74% are female.
- 56.76% of the world’s active internet users access Facebook monthly
- 68.85% of the monthly users will log in daily on mobile devices or desktop
- 38.22% of the world’s total population uses Facebook every month
Statista, ITU, World Bank, We Are Social
Facebook Marketing Statistics
- 68 percent of American adults use Facebook. Social Media Dashboard
- Facebook counts about three billion monthly active users in 2025. Multiple trackers place MAUs near 3.07 billion. Business of Apps+1
- Family daily active people across Meta apps reached 3.48 billion in June 2025. investor.atmeta.com
- More than 200 million businesses use Meta apps and free tools. dataforgood.facebook.com
- Typical Page follower growth is low and varies by month and industry. Use the live benchmark for the latest month. Social Status
- Median engagement rate per Facebook post across industries was about 0.16 to 0.20 percent in the first half of 2025. Socialinsider
- Mobile first video is 27 percent more likely to drive brand lift than non mobile optimised video. Facebook
- More than one billion Stories are shared each day across Meta apps, and around 500 million people use Facebook Stories daily.
Facebook Advertising Statistics
- Average CPC on Facebook varies by objective. Traffic campaigns average about 0.77 dollars per click, while lead campaigns average about 1.92 dollars per click. Sprout Social+1
- Historical context that still gets cited. In Q2 2019 the average price per ad fell 4 percent and ad impressions rose 33 percent. That shift came from more inventory in Stories and Feeds. Q4cdn+1
- Clicking behaviour. The typical Facebook user now clicks about 12 ads per month. Yaguara
- Mobile’s share of Facebook ad revenue remains dominant. The last disclosed split put mobile at about 94 percent. Meta no longer breaks this out each quarter, but independent trackers still reference that level. Yaguara+1
- Social referrals to retail. Facebook remains a leading referrer of social traffic to ecommerce. Recent aggregations put Facebook near half of social referral traffic across North America, though shares vary by source and methodology. SQ Magazine
- Market position in digital ads. Google, Meta and Amazon together command about seventy-two per cent of the United States’ digital ad spend. Meta is one of the three largest sellers.
Most of these stats are taken from Facebook’s quarterly reports and the Facebook Newsroom.
2. YouTube Statistics
YouTube was created by Steve Chen, Chad Hurley and Jawed Karim in 2005. First of all, YouTube is the second biggest search engine, that means a lot of people use it.
Second, it’s ranked number two, which makes it a great place to market your business.
What so incredible is the size and scale of YouTube as you can see in their social media statistics:
- According to Alexa rankings, YouTube is the second most-visited site in the world.
- Video marketing revenue is expected to keep growing by 14.6% each year.
- The average revenue per internet user is $8.34.
- 6 out of 10 people prefer online platforms over TV.
- 81% of businesses use video as a marketing tool.
- Over 500 million hours of video are watched on YouTube every day.
- 9% of small businesses in the US use YouTube for advertising.
YouTube Demographics
- Over 90% of 18-44 year old American internet users watch videos on YouTube.
- Over 80% of 45-64 year old American internet users watch videos on YouTube.
- Over half of American internet users who are aged 65 and over watch videos on YouTube.
- 59% of Generation Z (16-24-year-olds) have increased their YouTube usage since last year.
- 46% of millennials (25-34-year-olds) have increased their YouTube usage since last year.
- 70% of millennial YouTube users watched a YouTube video to learn how to do something new or learn about something they’re interested in.
- 35+ and 55+ age groups are the fastest growing YouTube demographics.
YouTube Usage Statistics
- 10% of the most popular YouTube videos draw 79% of views.
- In a 2019 survey, 28% of adults said they get news there, behind only Facebook (52%).
- YouTube says 250 million hours of watch time per day are happening on TV screens.
- 70% of YouTube watch time comes from mobile devices.
YouTube Marketing Statistics
- In the U.S. alone, YouTube will make 5.5 billion dollars in advertising revenue in 2020.
- The number of channels that earn $10,000 USD per year or more on YouTube grew by 50%, year over year.
- YouTube’s Google Preferred ads lift ad recall by 112%. YouTube’s Google Preferred ads are ads that run on YouTube’s top 5% most popular channels.
YouTube advertising is based on a cost per view – it is one of the most cost-effective advertising solutions:
- Average CPV: $0.026
- Average view rate: 31.9%
- Average view CTR: 0.514%
Many of these stats came straight from either the YouTube Blog and their Press page.
3. WhatsApp Statistics
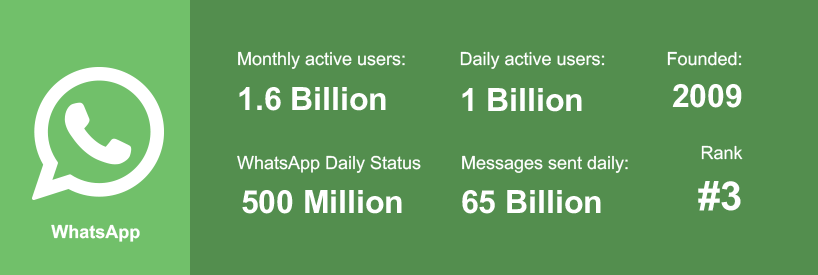
WhatsApp is an instant and secure messaging application. It was founded by Jan Koum and Brian Acton in 2009 and later bought by Facebook for $19 billion in 2014.
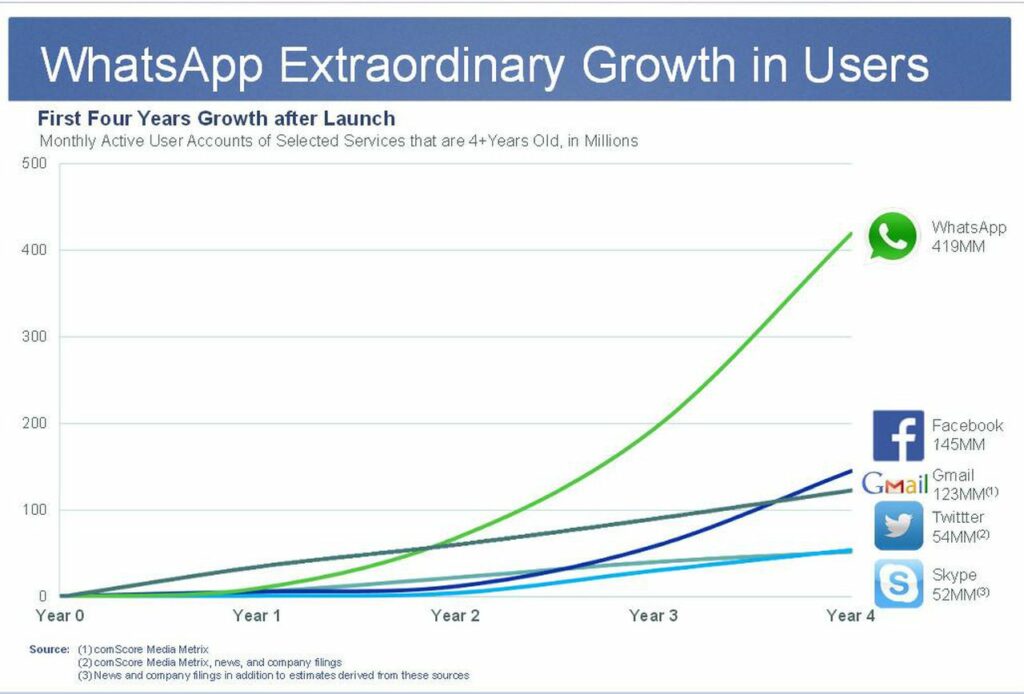
Eleven years in and the 11 years and you can see it has become a dominant force in communications and social. Whatsapp social media statistics:
WhatsApp Demographics
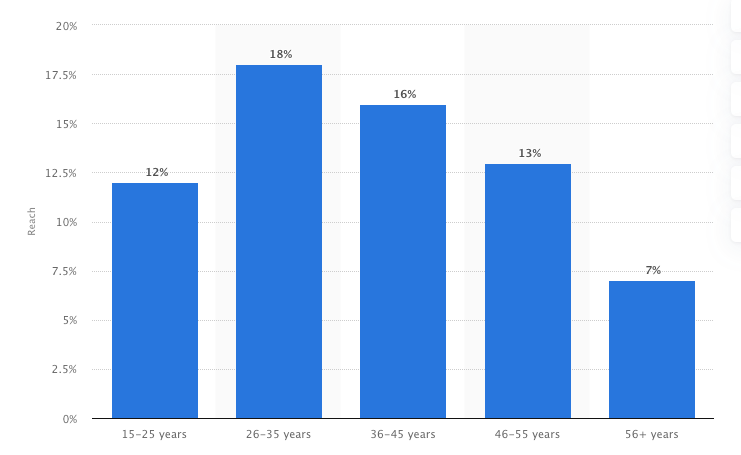
WhatsApp Quick Facts
- 1.5 billion users in 180 countries make WhatsApp the most popular messaging app in the world.
- India has the largest number of WhatsApp users — 400 million.
- WhatsApp has 55 employees and 50 engineers.
- WhatsApp is banned in 12 countries including China, Bangladesh, Iran, North Korea, Syria, UAE, and others.
WhatsApp Usage Statistics
- 1 million people register on WhatsApp daily.
- The average user checks WhatsApp more than 23 times per day.
- The number of WhatsApp users in the USA is predicted to grow to 25.6 million by 2021 – Source Statista.
- More than 2 billion minutes of voice and video calls are made on WhatsApp daily.
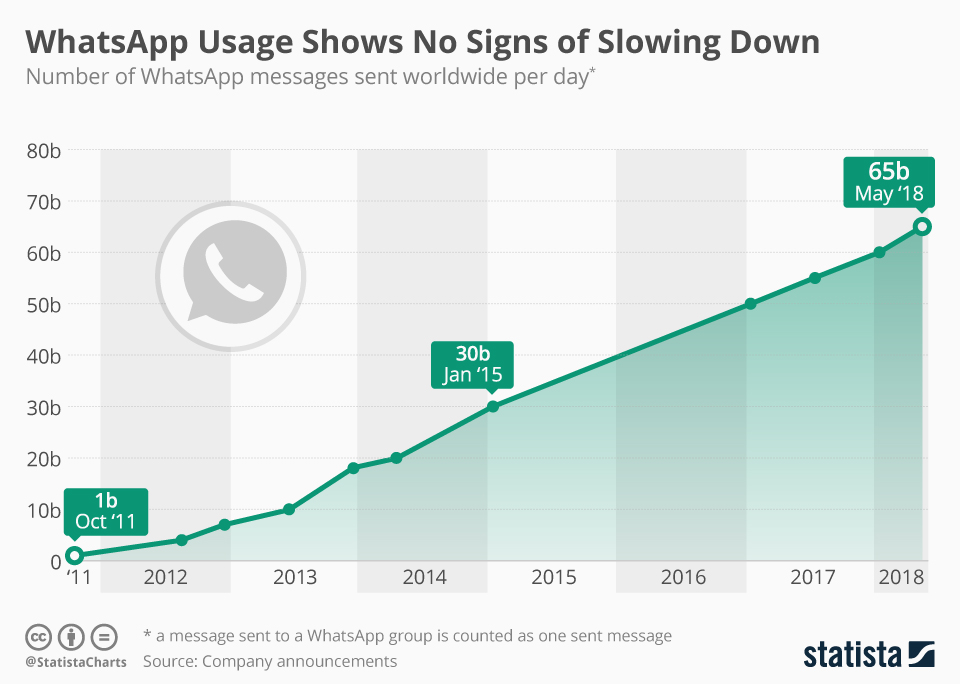
- 65 billion text messages are sent through WhatsApp daily – Source Statista.
- One billion groups are in use on WhatsApp – Source Jan Kourn.
This data was sourced through a number of different sources.
4. Facebook Messenger Statistics

Facebook Messenger launched in 2011 and since then it has become one of the most downloaded apps.
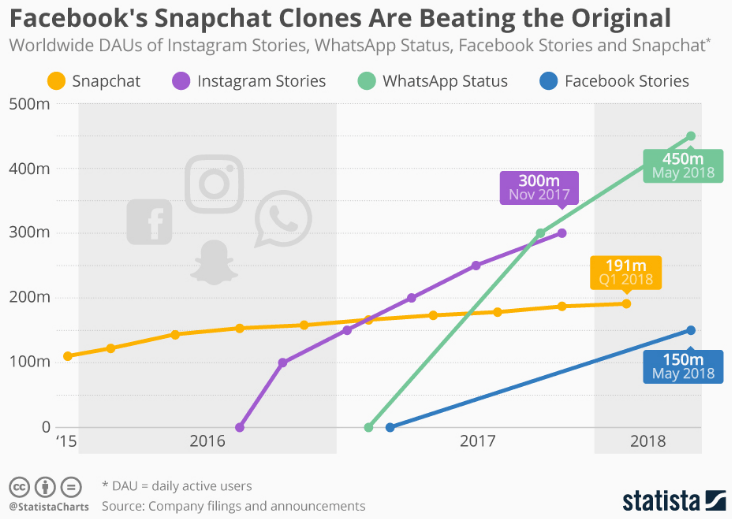
Mark Zuckerberg acknowledged that private messaging, ephemeral stories and small groups are by far the fastest-growing kinds of online communication. Since Facebook owns Whatsapp as well as Facebook Messenger it is well placed to take advantage of this trend.
- 20 billion messages are sent between people and businesses every month.
- There are 300,000 active Messenger bots on the platform.
- 8 billion messages have been exchanged between Facebook users and businesses that are utilizing chatbots.
- Email has 5-10% open rates and a 1% clickthrough rate. This amounts to 1 clickthrough per 1,000 emails. Messenger, by contrast, averages 70-80% open rates and 20% clickthrough rates.
- Users have 7 billion conversations on Messenger every day. That’s over 2.5 trillion conversations every year. For comparison, Snapchat users send 3 billion photos per day.
- 260 million new conversations are started daily. These are not just new threads between people, but between people and businesses too. This number will only grow.
- 18 billion GIFs were shared via Messenger in 2019. In the world of Messenger, GIFs are sent over 500 times per second. GIFs are a powerful communication and storytelling medium for both consumers and brands.
5. WeChat Statistics

WeChat was developed by and belongs to Chinese tech behemoth Tencent Holdings – the fifth-biggest company in the world, worth $500 billion.
Other names in the Tencent stable include QQ Messenger and Riot Games (League of Legends), among many others. It also holds various significant stakes in other international app names (Snapchat, Fornite).
WeChat User Statistics
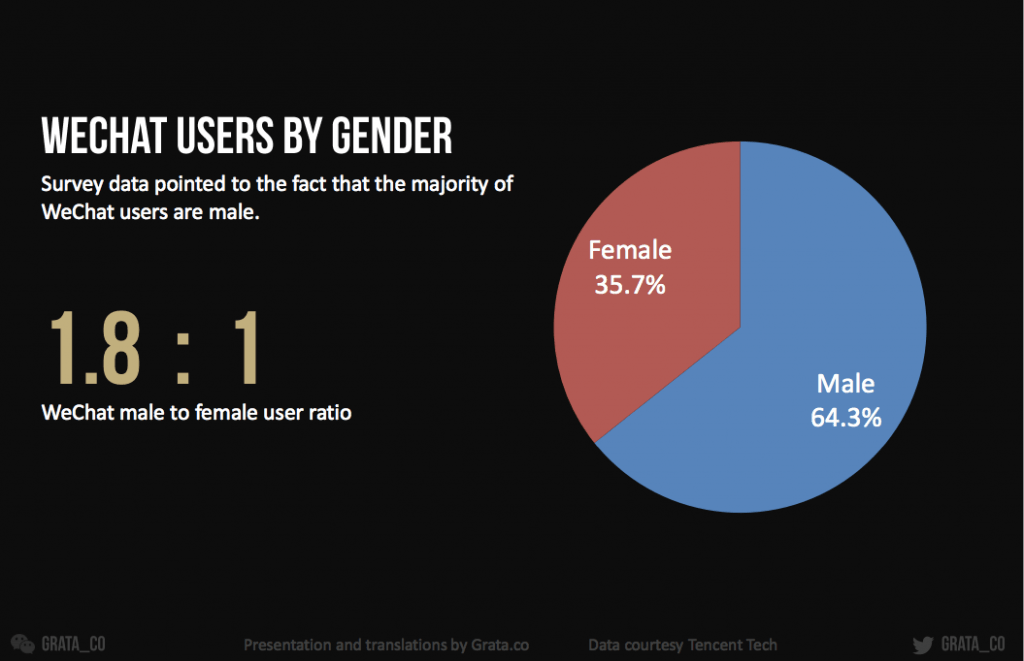
- Tencent claims one billion daily active users (Jan 2019) – Source: Tencent.
- WeChat the fifth most-used app in the world.
- 45 billion WeChat messages sent on a daily basis – Source: TimeOut Beijing.
- WeChat has 68M videos uploaded every day – Source: In The Black.
- 46TB of data consumed on WeChat over one minute of the morning rush hour.
- WeChat accounts for 34% of total mobile data traffic in China.
- 98.5% of 50- to 80-year-old smartphone users in China use WeChat – Source: Technode, China Daily.
- Users spend more than 66 minutes on WeChat daily – Source: The Telegraph.
- Around 30% of mobile internet time in China is spent on WeChat
- One million WeChat mini-programs are used by 600 million people.
- 170 million WeChat mini program users per day.
- The average user opens four mini-programs daily.
- 900 million users of WeChat Pay on a monthly basis.
- WeChat Moments has 750 million daily users.
6. Instagram Statistics

Instagram was created by Mike Krieger and Kevin Systrom in 2010. Initially, it was mainly designed to help people share photos and videos, both publicly and privately. As a result of early success, it was acquired by Facebook in 2012.
In a short time, 8 years, Instagram has become one of the biggest social media sites. Take a look at these amazing Instagram statistics:
How Many People Use Instagram?
- 1 billion accounts login, post, like, and comment on images each month, that’s one in seven people across the globe.
Instagram Demographics
- 52% of Instagram users are Females and 42% are male.
- 110 million Instagram users are from the US.
- Instagram is used by 43% of American women and 31% of men.
- 37% of US adults use Instagram and the United States has the most number of Instagram users.
- Six in ten online adults have Instagram accounts.
- 32% of all Internet users are on Instagram.
- 31% of internet users between the ages of 18 and 24 use Instagram and 32% of internet users between the ages of 25 and 34 use Instagram.
- 72% of teens use Instagram.
- 130 million Instagram accounts tap on a shopping post to learn more about products every month.
- 35% of US teenagers say Instagram is their preferred social media platform.
- 63% of Americans use Instagram daily.
Instagram Usage Statistics
- To date, more than 50 billion photos have been shared on Instagram.
- The average number of likes per Instagram post is 1,261.
- 57% of Instagram users access the site every day.
- Engagement rates on Instagram are 15 times higher than Facebook and 20 higher than Twitter.
- Today, 86% of top brands have Instagram accounts, that’s up from 71% from last year.
- 73% of brands post at least one photo or video per week on Instagram.
- Brands on Instagram with over 100K followers have grown by 163% in two years.
- 54% of brands promote their Instagram accounts through custom tabs on Facebook.
- Engagement with brand posts on Instagram are growing at a greater rate than brands are adopting the network.
Instagram Marketing Statistics
- Brands see engagement rates 10x higher on Instagram than they do on Facebook.
- Posts containing videos receive about 38% more engagement than those containing images.
- Brands post an average of 1.5 times per day.
- It can take up to 19 hours to receive 50% of a post’s total engagement.
- Instagram’s potential advertising reach is 849.3 million users.
- Instagram advertisers can reach a youth audience of 52.9 million.
- Brands pay Instagram influencers between $100 and $2,085 per post.
- Brands post an average of 1.5 times per day.
- The average engagement rate for branded posts on Instagram is 4.3%. The median engagement rate is 3.5%.
- U.S. marketers spend 31% of their Instagram ad budget on Stories
- 70% of users look up a brand on Instagram.
- 60% of users learn about new products through Instagram.
- More than 200 million users visit a business profile at least once daily.
- One-third of Instagram users have purchased through the platform on mobile.
7. QQ Statistics

- 808 million monthly active users – this has dropped since 2016 when QQ had a peak of 899 million users.
- 100 million QQ highlight users.
- 80 million QQKanDian users.
- 254 million QQ music users.
- 921 minutes per month is the average time spent on the app by young people.
8. TikTok Statistics

Musical.ly was rebranded as TikTok after being acquired by Chinese company ByteDance the year before. TikTok has created a massive stir in social media and a revival of short video clips. Now, it’s even more interactive, collaborative, and downright addictive for many users.
It has surpassed all other apps for downloads and is growing faster than any other social media platform. At a valuation of more than $75 billion, it’s the first Chinese internet company with a “significant, genuinely engaged following around the world,” according to The Verge.
Brands are now focused on seizing the opportunity to capitalize on the app’s remarkable success to launch influencer marketing campaigns with top TikTok creators. TikTok is the world’s hottest app and is rapidly expanding into the influencer marketing arena, and so marketers need to know these essential TikTok statistics :
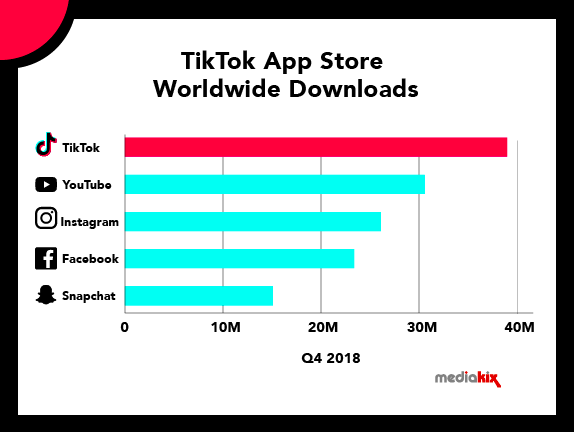
- As of early 2019, TikTok is the third-most downloaded app globally. (Business of Apps).
- In February 2019, TikTok hit 1 billion downloads, beating Instagram and Facebook in app stores. (Business Insider).
TikTok Demographic Statistics
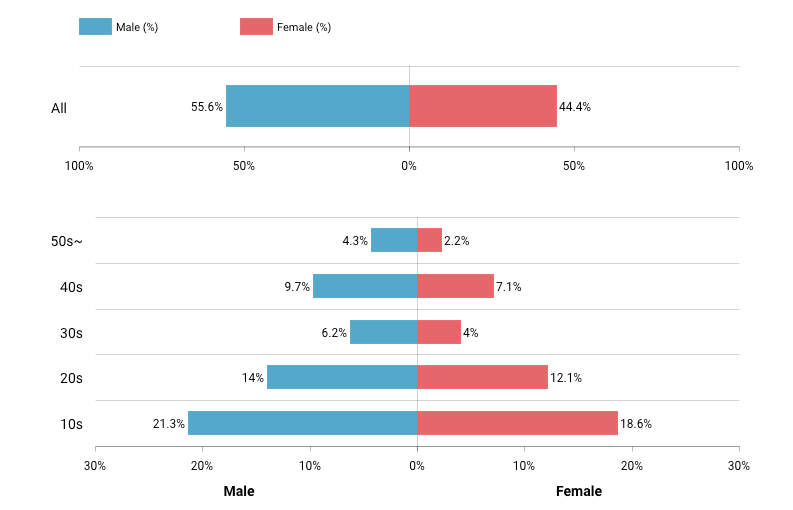
- TikTok’s user base is dominated by Gen-Z in the United States, many millennials have adopted it around the world.
- 50% of TikTok’s global audience is under the age of 34 with 26% between 18 and 24. (MarketingCharts)
- one in eight adults has joined TikTok. (MarketingCharts)
- 56% of TikTok users are male, 44% are female. (AppApeLab)
- Over 500 million of TikTok’s monthly active users are Chinese. (AdAge)
- 60% of TikTok’s U.S. audience is between the ages of 16 and 24. (Digiday)
TikTok Usage Statistics
- The average user spends 52 minutes per day on TikTok. (BusinessOfApps)
- TikTok’s average engagement rate is 29%.
- 90% of TIkTok users visit the app more than once per day. (GlobalWebIndex)
- The most followed individual on TikTok is a comedic poster and influencer named Loren Gray. She has 34.4 million followers. (TikTok)
TikTok Marketing Statistics
- TikTok now offers five advertising tiers aimed at big brands. One of which, a branded hashtag challenge, reportedly costs $150,000 per day. (TikTok Pitch Deck Notes First Reported by Digiday)
9. Weibo Statistics


Weibo is the Chinese equivalent of Twitter. With more than 462 million monthly active users on the platform, many international companies have registered for Weibo official accounts to promote their brands in China, such as L’OrealPro, Coca-Cola and The Australian Tourism Board. What’s impressive is the revenue generated through ads – $1.72 billion, with $1.5 billion coming from marketing and advertising revenues.
Weibo Demographic Statistics
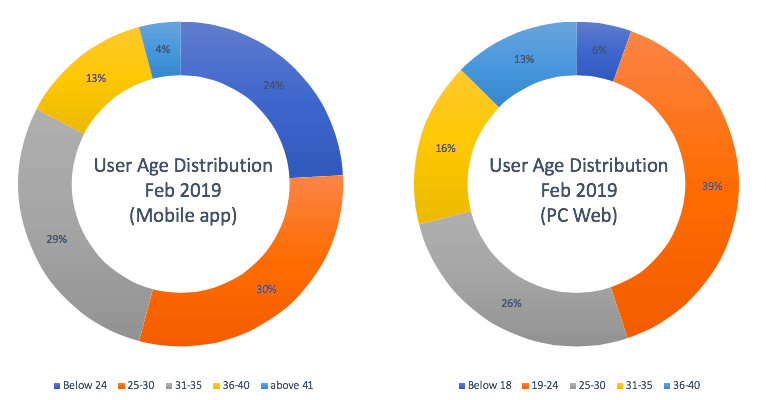
- According to IResearch, Weibo has a significantly younger user demographics, for which more than 50% of them aged below 30 (for both mobile and PC users).
10. Reddit Statistics

Reddit is a discussion and web content rating website. It was founded by Alexis Ohanian and Steve Huffman from the University of Virginia in 2005.
And while it isn’t receiving anywhere near as much press buzz, it is a thriving and vibrant community of people. Many of them total trolls, but hey, trolls are people too.
It’s also been known to completely tank websites by sending enormous, and unsustainable amounts of web traffic when things hit the front page. So, be sure to use it for your own blog posts with caution.

A lot of these statistics can be found if you search through their advertiser or press pages.
- Reddit’s ad revenue is expected to be $261.7 million by 2021. (eMarketer)
- Reddit is the 5th most popular websites in the US, ranking behind Google, YouTube, Facebook, and Amazon. (Alexa.com)
- There are 1.7 billion comments on Reddit.
- 40 million searches are made on Reddit every day.
Reddit Demographic Statistics
- Reddit generates 168 billion+ views each year.
- Reddit is the 5th most popular site in the U.S.
- 54% of Reddit visitors are from the U.S.
- 45% of Americans 25-34 years old have used Reddit.
- 70% of Reddit video views are viewed on mobile.
- 69% of American Reddit users are male.
Reddit Usage
- 150 million pages are viewed on Reddit every day. Source: QuickSprout.
- Average Redditor spends 15 minutes and 10 seconds on each visit. Source: DMR
A 2016 study found people between the ages of 30-49 accounted for 33% of the site’s users, indicating that Reddit is a viable platform for reaching both young and middle-aged adults.
11. Twitter Statistics

Twitter was founded in March of 2006 by Jack Dorsey, Biz Stone and Evan Williams. Initially, it was created as an experiment in messaging. Fast forward 12 years and it is a global phenomenon.
In Twitter’s own words:
[Twitter is] what’s happening in the world and what people are talking about right now.
Twitter Demographics

Twitter Usage
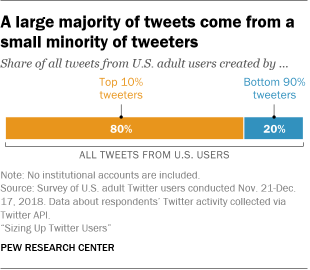

- About 46% of Twitter users use the site daily.
- 83% of the world’s leaders are on Twitter.
- 79% of accounts are held outside of the U.S.
- Twitter estimates 23m of its active users are actually bots.
- The average Twitter user has 707 followers.
12. Pinterest Statistics

Pinterest is a mobile application that enables you to find information on the World Wide Web. It was founded by Evan Sharp, Ben Silbermann and Paul Sciarra in 2010.
- Pinterest has over 322 million monthly active users.
- According to Pinterest, 55% of Pinners are specifically looking for products.
- 83% of weekly users have made a purchase based on content they see from brands on Pinterest.
- 75% of Pinterest users say they’re “very interested” in new products.
- Seven out of every ten Pinterest users are female (eMarketer, 2018).
- In the US, 28 percent of all adult social media users use Pinterest.
- Pinterest users spend an average of 14.2 minutes on the social media platform every day.
- Pinterest is also the third most popular mobile social networking app in the US and users spend an average of 5.29 minutes per mobile app session (Statista, 2019).
- Users pin more than 14 million articles each day.
- More than two-thirds of all Pinterest users live outside of the US.
13. LinkedIn Statistics

LinkedIn is a professional networking service that was founded in 2002 but later launched in 2003.
It started as a place to simply keep your resume updated and didn’t really turn into a full-on social network until Facebook was well into its prime.
Microsoft, recognizing the value of LinkedIn, acquired the company for $26.2 billion in 2016. However, unlike many other social media platforms, which rely on advertisements, LinkedIn’s services are something for which users are willing to pay. LinkedIn is projected to hit $6.4 billion in revenues for 2019.
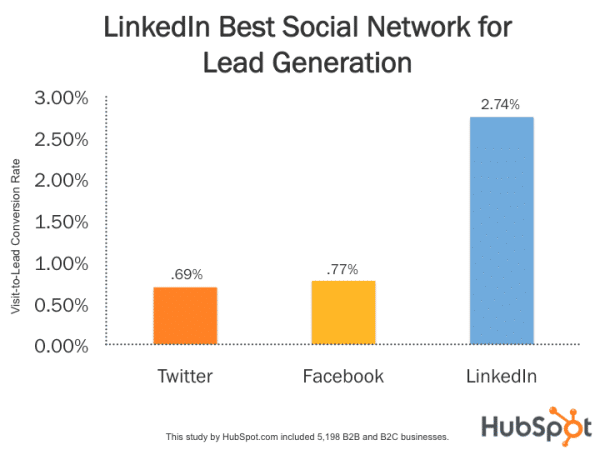
LinkedIn is an especially good source for discovering leads. Hubspot found that LinkedIn is 277% more effective at generating leads than Facebook and Twitter.
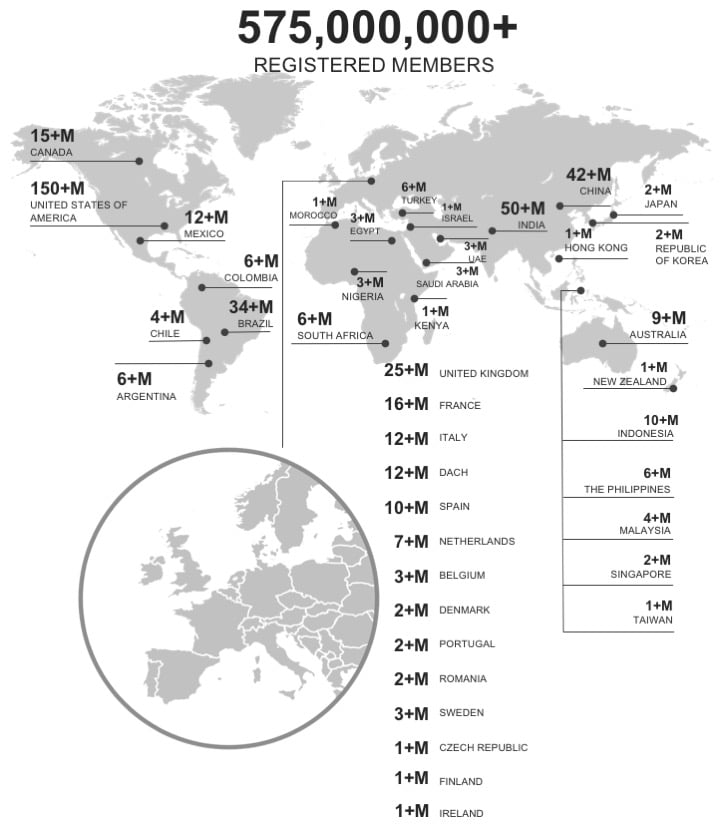
The active user base of LinkedIn is debated. Using SimilarWeb data, We Are Social and Hootsuite in October 2019 estimate LinkedIn MAUs at 310 million (47% of members). This is relatively consistent with Boston-based Apptopia’s 2017 estimate of an active LinkedIn user base of around 250 million in 2017, representing 50% of its 500 million members at the time.
- 79% of marketers see LinkedIn as a very good source of leads.
- Content on the LinkedIn feed receives about 9 billion impressions per week.
- 98% of content marketers use LinkedIn for content marketing, especially for B2B marketing and lead generation.
- LinkedIn Video was named one of the most effective platforms for video marketing.
- 90 million LinkedIn users are senior-level influencers and 63 million are in decision-making positions.
- 25% of Millenials (18-24 years old) use Linkedin.
- 49% of Linkedin users earn more than $75,000 in a year.
- LinkedIn is the #1 channel B2B marketers use to distribute content at 94%.
- 122 million people received an interview through LinkedIn.
- There are 3 million MBA graduates on LinkedIn.
- There are 6 million IT decision–makers on LinkedIn.
14. Snapchat Statistics

Snapchat is a multimedia mobile application which was created by Bobby Murphy, Evan Spiegel and Reggie Brown in 2011. Snapchat was introduced as an iOS-only app and called Picaboo.
It started as a private messaging app that gave users the ability to create “snaps” or messages that would self-destruct (be automatically deleted) after being viewed. Unlike all the other social media apps and networks in which you had to manually delete posts, you’ve shared.
For many, this was empowering because they didn’t have to worry about sending something that they’d regret years down the road.
For others, it just seemed like a breeding ground for sexting and “unscrupulous” behaviour that people wanted to hide.
When Snap, Inc. became a publicly-traded company, it decided to evolve into calling itself a “camera company.” Very few people understand that decision. However, since then it has had mixed fortunes and lost ground to Instagram.
Snap reported a net loss of $2.2 billion in Q1 of 2017. They lost nearly $40 million on unsold Spectacles they hastily manufactured without factoring in a matching demand.
Snapchat Demographics
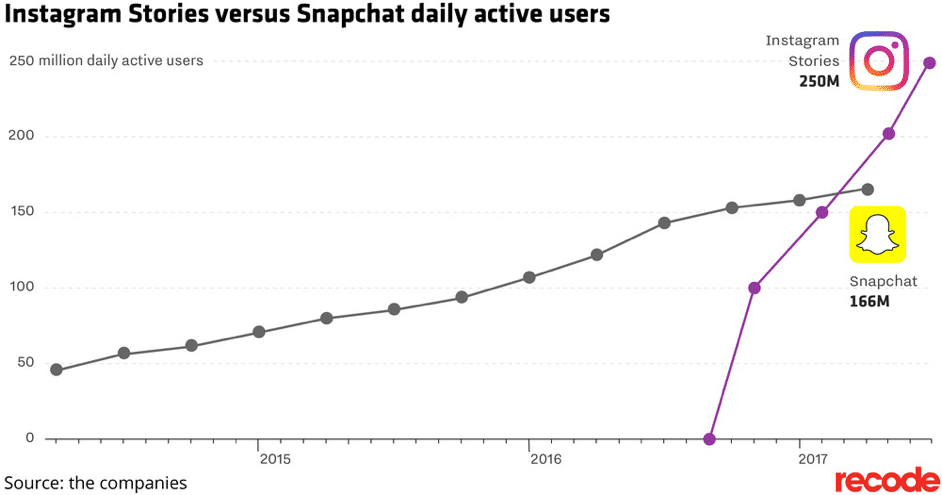
Snapchat is regaining momentum and users as can be seen from the growth in daily active users.
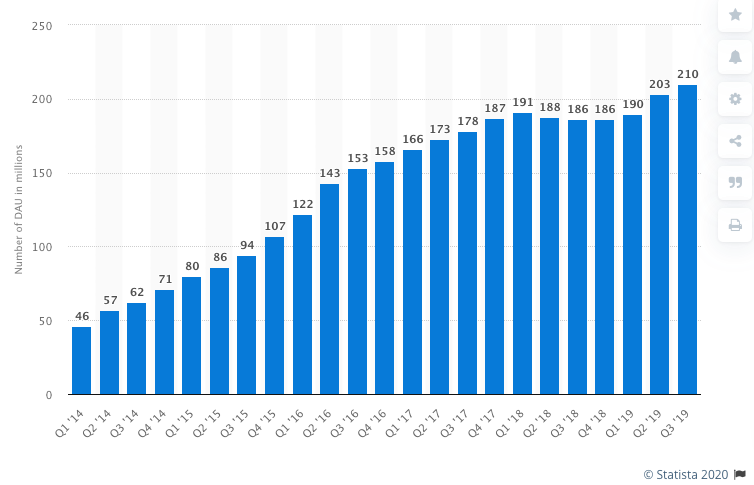
- Snapchat users share 2,083,333 snaps every minute. Source: Statista.
- 95 million people use the Snapchat camera every day. Source: Snapchat.
- According to Snapchat, users open their app more than 20 times a day on average.
- According to Linqia, only 22% of marketers say that Snapchat is the most important platform for their influencer marketing campaigns.
Social Media Statistics Infographic

If you’d like to embed this infographic on your own website, just copy the code below:
<a href="https://www.garyfox.co/social-media-statistics"><img src="https://www.garyfox.co/wp-content/uploads/2024/07/Social-Media-Statistics-infographic-2020.png" alt="Social Media Statistics 2020" width="800" border="0"></a>