The Netflix business model is being replicated by competitors. How well-positioned is Netflix to fend off competitors and will it continue to show strong growth?
We’ll examine the Netflix business model and examine some of its key financials.
Let’s get being with the background of Netflix and how to grew to be such a dominant global player in the video streaming sector.
| Company name: | Netflix |
| Founders: | Reed Hastings and Marc Randolph |
| Annual revenue: | 2019: $20.16 Billion |
| Profit | Net Income: | 2019: $1.86 |
| Market Cap: | (April, 2020): $423 Billion |
| Year founded: | 1997 |
| Company CEO: | Reed Hastings |
| Headquarters: | Los Gatos, USA |
| Link: | Netflix |
| Number of employees: | (FY 2019): 8,600 |
| Type of business: | Public |
| Ticker symbol: | NLFX |
| Products And Services: | Video On Demand, |
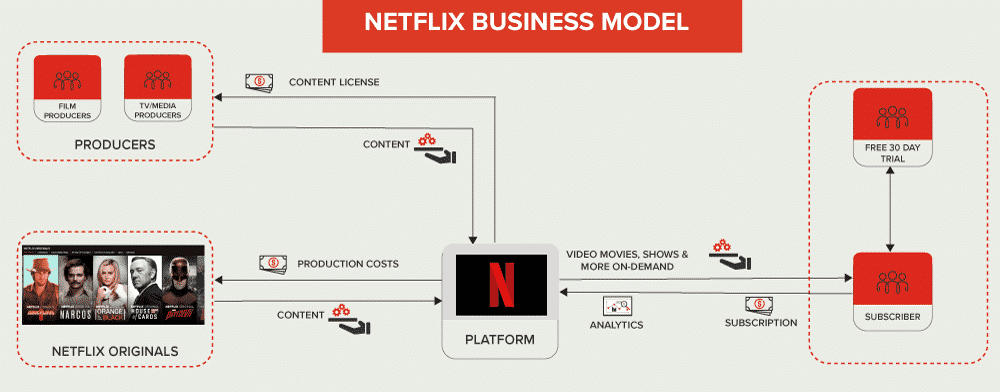
The Netflix business model is a platform that offers on-demand streaming of video for a subscription fee. An initial hook is to offer people one free month as a trial period or more recently Netflix is being bundled with mobile packages.
Netflix offers non-linear viewing. Linear viewing is a term used for watching content at the time of broadcast. Non-linera is basically on-demand viewing.
Netflix competes in the subscription video-on-demand market. A quick overview will help you to understand some of the trends that are shaping the Netflix business model and its performance.
Table of Contents
The Subscription Video-On-Demand Market
Subscription video-on-demand (SVoD) is increasing globally and this trend will help Netflix.
There is a strong trend to video-on-demand streaming, as an example 48% of all United States consumers stream television content every day or week.
With players like Netflix releasing a complete series at once also increases the amount of time spent on their platforms – referred to as binge-watching.
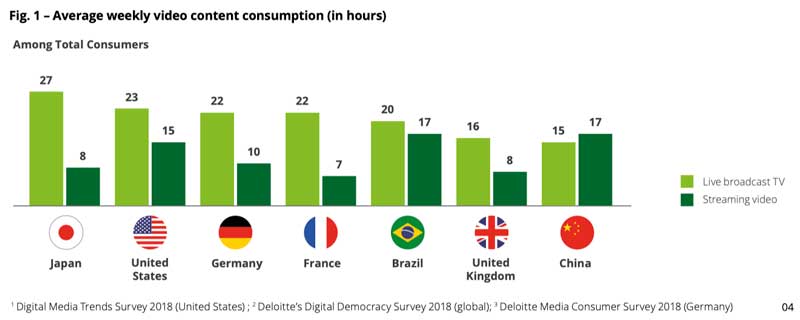
Despite the trends, there are significant regional differences, often as a result of available technologies and bandwidth.
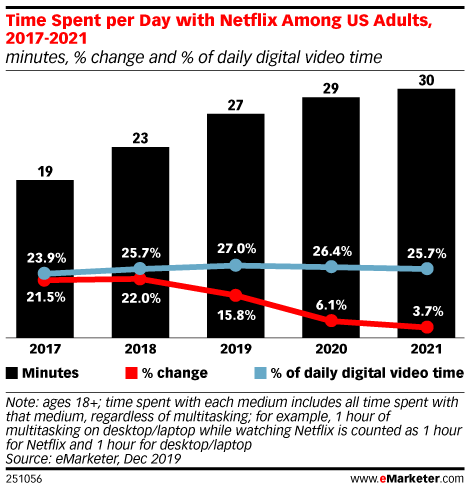
A key challenge for Netflix in the US and Canada markets which are, at the moment, the largest markets. New entrants such as Disney could possibly erode market share.
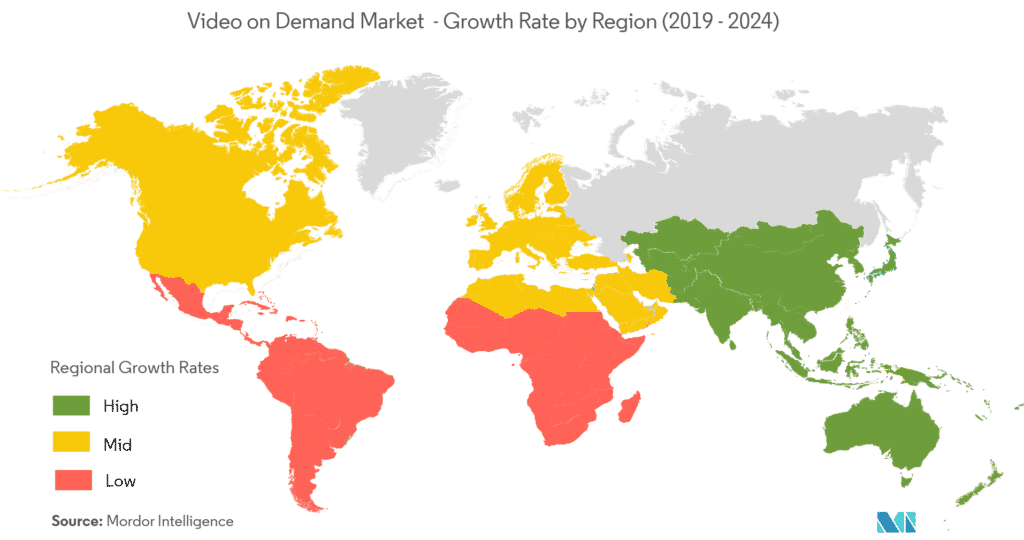
According to Mondor Intelligence, the Video on Demand Market was valued at USD 56.55 billion in 2019 and is expected to reach USD 120.91 billion by 2025, at a CAGR of 13.5% over the forecast period 2020 – 2025.
If Netflix just maintains its current share of the market, it should grow by 13.5% based on new users. This is an important figure to remember as we look at their financial performance.
NetFlix Statistics – Quick Facts
- Netflix was founded in 1997.
- The company began offering a subscription-based DVD-by-mail service in 1999.
- Netflix broke 4 million subscribers in 2005.
- Netflix launched online video streaming in 2007.
- In 2009, Netflix landed on the PS3 and smart TVs.
- In 2013, Netflix launched its first three original series, House of Cards, Hemlock Grove, and Orange is the New Black.
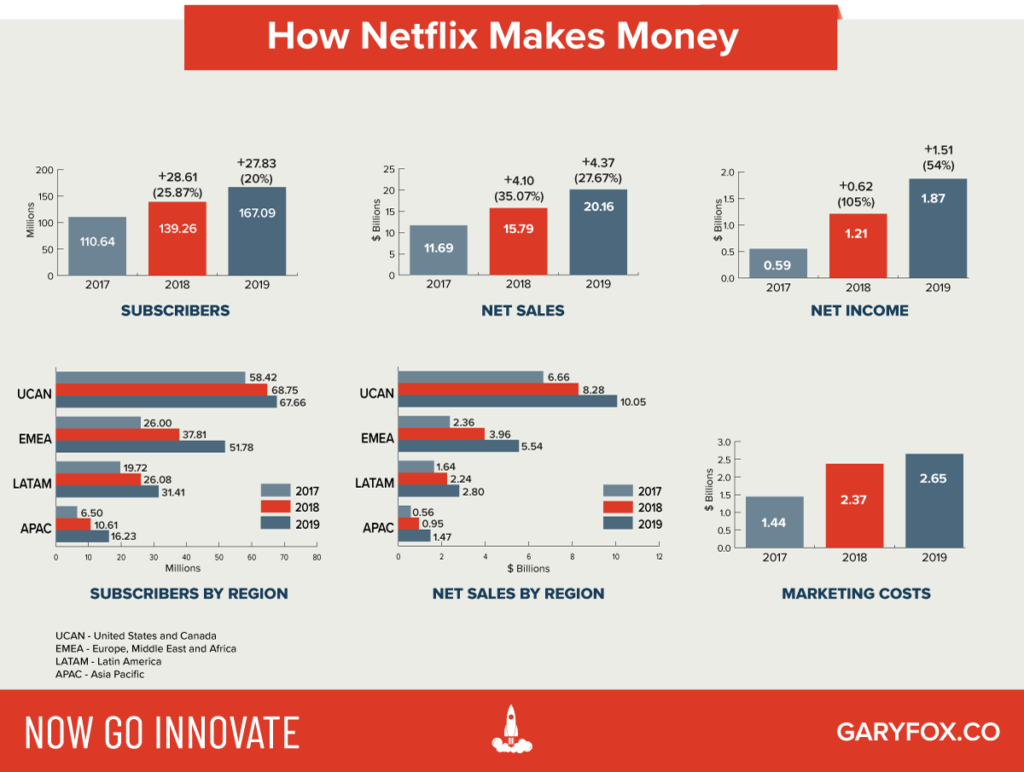
- Netflix has over 167M as at the end of 2019.
- Netflix generated over $20 Bn of revenue in 2019.
- Netflix continued its march across the globe in 2015, finally launching its service in Australia, New Zealand, Japan and other locations.
- As of 2016, Netflix was made available worldwide except for a select few countries.
- In 2017, Netflix won its first Oscar. The service’s original content The White Helmets won in the Best Documentary Short Subject category.
- As of 2018, Netflix officially beat HBO’s 17-year-long run in Emmy nominations.
From DVD pay rental business model To On-Demand Streaming
Today we take for granted the on-demand business model of Netflix. But the journey of Netflix started back in 1997. Reed Hastings and Marc Randolph started offering video-rentals as a service through the internet and then mailing DVDs.
However, within two years Netflix pivoted to a monthly subscription allowing customers to access an unlimited number of DVD rentals.
As internet bandwidth grew, Netflix saw the opportunity to transform its business model and offer video streaming. Having made significant investments in the development of a platform, they were able to launch their streaming service in 2007.
Today, Netflix has over 167 million (Q4 2019) reported subscribers across 190 countries.
Netflix Business Model Canvas
Another way to look at the Netflix business model is to use the now-famous business model canvas. If you want to learn more about how to use the business model canvas follow the link.
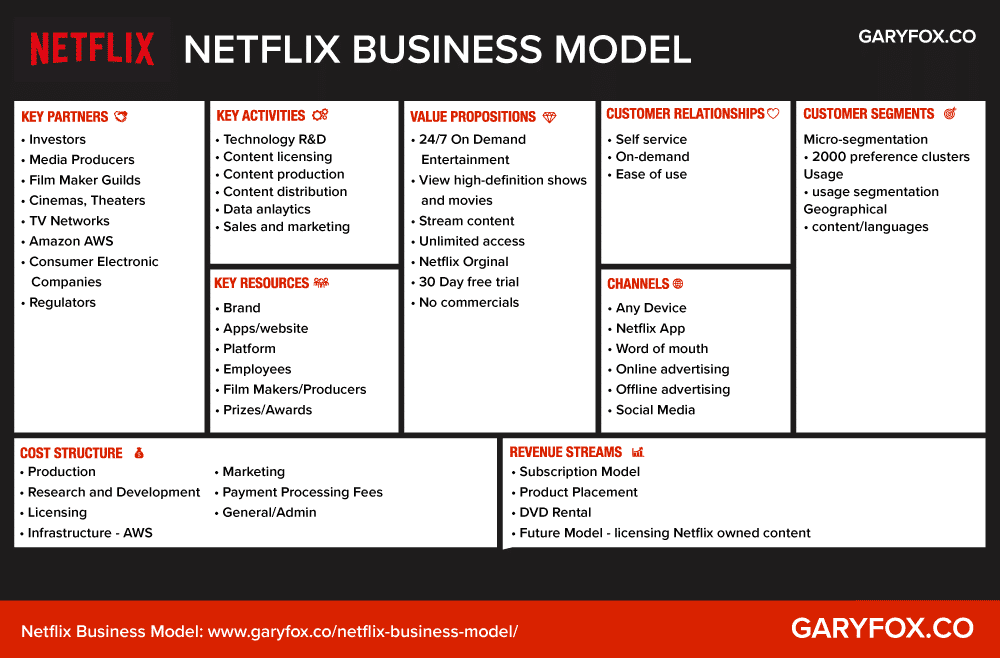
The Netflix business model is based on acquiring and producing content and then distributing this via its platform. What makes it so appealing is that it offers on-demand viewing of content and also personalization.
Netflix harnesses the power of the subscription business model to gain regular and repeat revenue.
Key Partners
- Investors – the range of investors who provide access to money.
- Media producers – media producers who then license content to Netflix.
- Filmmaker guilds – Directors, actors, writers, and their guilds/unions are some of the most powerful players in the (US) film industry.
- Cinemas and theaters – a new and possibly interesting trend.
- TV networks – who license their IP to Netflix for their own content creation.
- Consumer electronic producers – who bundle Netflix with their systems e.g. Sony Playstation.
- Amazon AWS – The whole Netflix technology platform is hosted on Amazon AWS.
- Regulators – Policies of the Federal Communications Commission (FCC), esp on the topic of net neutrality can have a crucial influence on Netflix.
Key Activities
- Technology R&D – As technology keeps changing Netflix needs to continually invest in and renew its tech stack.
- Content licensing – To remain relevant and appeal to its 2000 micro-segments Netflix needs to continually select and purchase content.
- Content production – Since 2013 Netflix has produced its own content – Netflix originals.
- Content distribution – the optimization of video streaming across the globe.
- Data analytics – analytics to constantly understand customer behavior to improve the overall user experience and hence reduce churn.
- Sales and marketing – to grow customers at the lowest cost possible but optimizing with the right customer fit – to maximize CLV.
Key Resources
- Brand – they rank in the top 100 global brands.
- Apps/Website – the main channel for content delivery.
- Platform – the analytics and overall system for delivery, customer personalization and streaming.
- Employees – general staff plus technical staff who maintain the platform and develop it.
- Filmmakers/producers – their relationship with leading writers and producers.
- Prizes/Awards – nominations help promote their content to a global audience.
- Content library – a huge catalog of content. Their own content could be licensed in the future.
- Studios: Netflix is creating its own studios and to support its content creation.
Value Proposition
- Content library – access to a huge library of content to suit all needs.
- On-demand streaming – anytime, any device streaming.
- Binge Watch – watch a whole season in one go.
- Original content – e.g. The Witcher.
- Localization – Orginal local content as well as licensed content.
- Free one-month trial – free trial with no restrictions.
- Low-monthly pricing – this depends on the economy of each Country (see later).
- Personalization – create lists and also get recommendations.
Customer Relationships
- Self-service – customers access services via the app.
- Personalization – tailored content and lists.
- User support – via live chat, email or call.
Channels
- Any device
- Netflix App
- PR/Word of Mouth
- Online Advertising
- Offline Advertising
- Social Media
Revenue Streams
- Subscription Model – the main source of revenue for Netflix.
- Product Placement – marginal earnings not significant.
- DVD Rental – still a revenue stream but becoming less important.
- Licensing own content – possible future income.
- Ads – possible future income.
Cost Structure
- Research and Development – the cost of research, patents, and development.
- Content Purchases – amortization of content – the biggest cost in the Netflix business model.
- Content Production – the cost of funding new content (same as above).
- Infrastructure – building, Amazon AWS and technology.
- Marketing – the costs associated with overall marketing and cost of customer acquisition.
- Payment Processing Fees – third-party fees.
- General /Admin – General costs associated with a business.
- Employees – staff.
Customer Segments
- Micro-segmentation – 2000 taste clusters.
- Usage segmentation – screens used, where used, how often used, when…
- Geographical segmentation – used for ad targeting, localization of content.
partners Improve Netflix Subscriptions
To improve the partner’s part of the Netflix business model, Netflix has expanded partnerships to include cable, home internet, and mobile carriers. The goal of these partnerships is to improve the uptake of subscriptions.
It is estimated that Netflix’s U.S. partnerships are adding about 1.2 million domestic subscribers per year according to a report by Barclays.
Customers taking two or more phone lines on their unlimited data plan are eligible to receive a free Netflix subscription.
Beyond its deals with T-Mobile and Comcast, Netflix also has an opportunity to make more bundling deals with pay-TV distributors.
Our business model is subscription based as opposed to a model generating revenues at a specific title level. Therefore, content assets, both licensed and produced, are reviewed in aggregate at the operating segment level when an event or change in circumstances indicates a change in the expected usefulness.
Netflix
revenue source of Netflix – Monthly Membership Fees
The only source of revenue is subscriptions. Netflix offers three different plans for users based on the streaming quality of the content provided:
• Basic – content can be streamed in Standard Definition.
• Standard – content can be streamed in High Definition.
• Premium – content can be streamed in Ultra High Definition.
The costs of these plans differ in different countries.
Netflix continues to show strong growth across all regions but there are concerns over the US market and the potential for Netflix to grow further. The concerns involve the heavier cost of customer acquisition in the US and also the more intense competition from Disney+, Amazon Prime and HBO.
The Netflix business model – Content investments
We acquire, license and produce content, including original programing, in order to offer our members unlimited viewing of TV shows and films.
Netflix
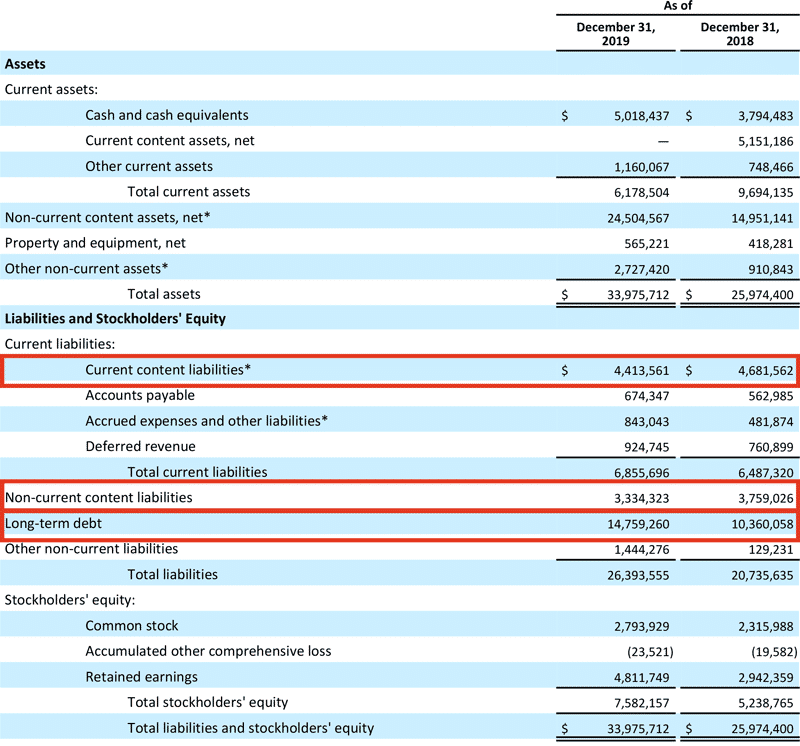
The content liabilities are due to the high cost of purchasing content from third-party as well as commissioning content for Netflix originals. The need to continually renew content to maintain customer loyalty is a key factor in the Netflix business model.
Netflix Customer Metrics
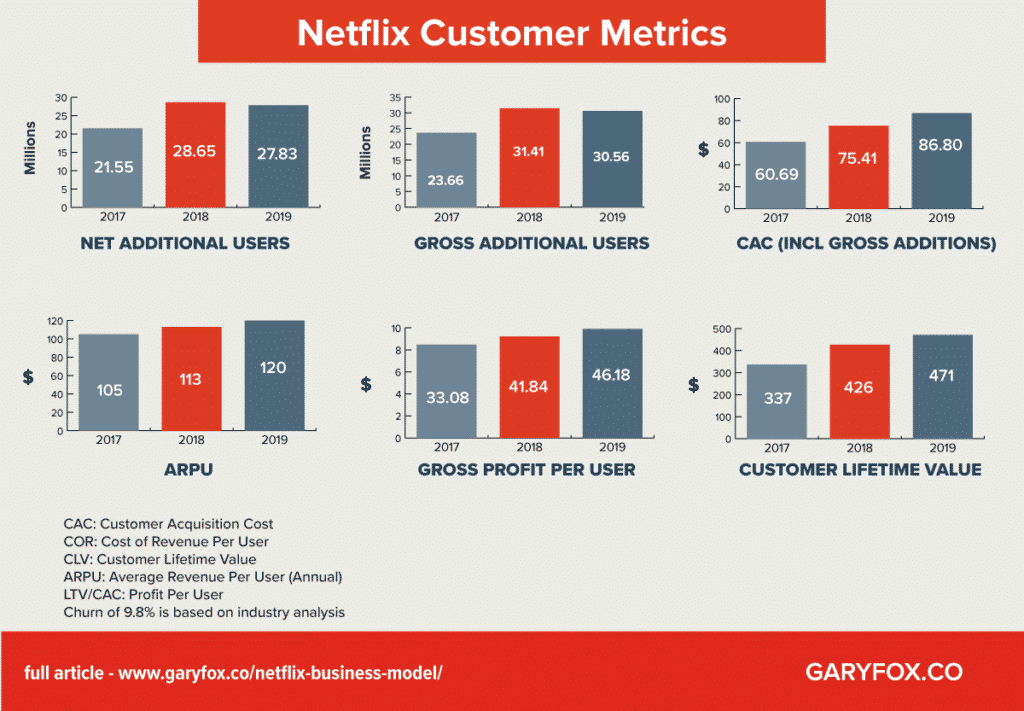
As with all subscription business models understanding the key financial drivers is critical to success.
Netflix Customer Acquisition Cost (CAC) and Customer Lifetime Value (CLV)
The key measures that drive the profitable of the Netflix business model and other subscription models are:
Today, we are going to look at a number of metrics that are being used in the context of assessing companies’ growth potential:
- CAC: Customer Acquisition Cost.
- CLV (or LTV): Customer LifeTime Value.
- ARPU: Average Revenue per User
- Churn rate.
These measures can then be used for further metrics such as the ratio of customer acquisition (CAC) to lifetime value. In other words, how much value is derived from a customer over the time they subscribe.
Netflix Cost of Acquisition (CAC)
In 2019, Netflix reported that there was a net gain in customers of 27, 831 customers for their streaming services.
The calculation for CAC = All costs related to acquiring new customers/number of new customers.
Simplified CAC = marketing costs / number of new customers.
For 2019: Cost of marketing = $2.65Bn therefore the CAC = $2.65 Bn/ 27.831M = $95.30.
However, this doesn’t account for churn. To add that many users Netflix also needs to make up for the losses through churn.
Assuming Netflix churn rate is 9.8% then the CAC is actually lower = Gross additional users = 30.56M.
This results in a CAC of $86.80.
Netflix Customer Lifetime Value
The average revenue per user (ARPU) is simply the total income / the number of users.
For 2019: ARPU = $19.859Bn (streaming only)/167M users = $120.63 (note this per annum). Per month this would be $120.63/12 = $10.05.
If Netflix has spent on average $86 to acquire a customer we want to know when that cost is recovered and then how long a customer stays to ensure profit. First of all, we need to know the gross profit per user.
Gross profit per user = revenue per user – cost of revenue per user.
The final calculation then is LTV = Gross profit per user / churn rate.
For the table below I have assumed a churn rate of 9.8% (Netflix does not reveal churn rate).
| Metric | 2019 Figures |
| ARPU (annual) | $120.63 |
| Cost of Revenue Per User | $74.45 |
| Gross Profit Per User | $46.18 |
| Churn Rate | 9.8% |
| LTV | $471.23 |
It is worth noting that some analysts place the churn rate as being a lot higher than 9.8% and closer to 20%. That substantially would change the dynamics of the above equation and effectively half the customer lifetime value.
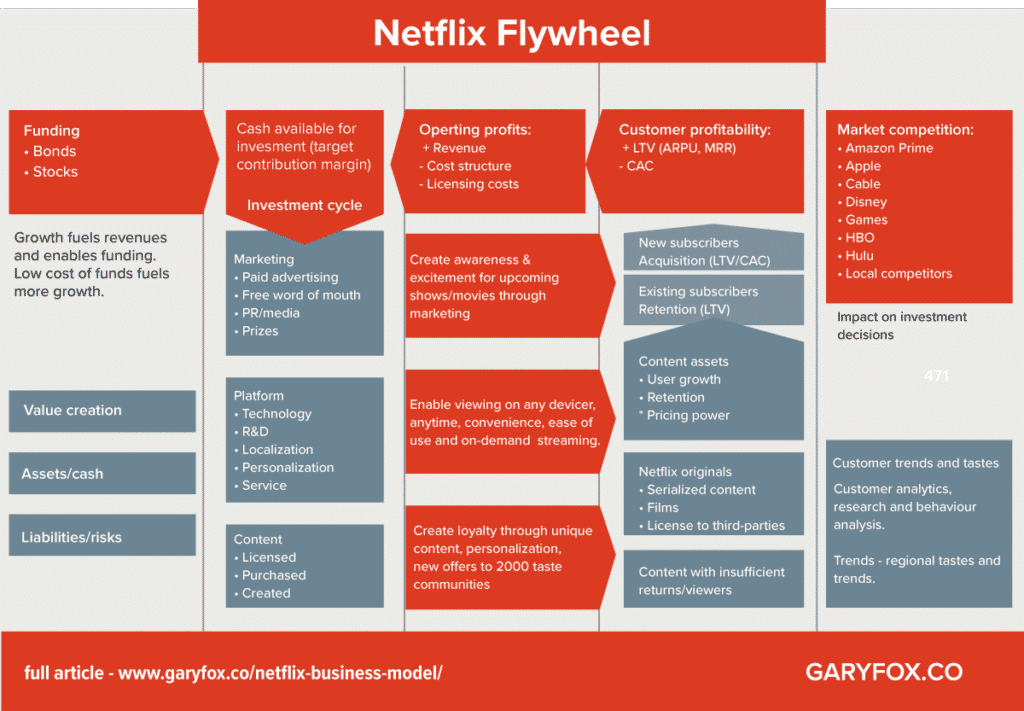
Netflix Cash Flow
Our plan is to continually improve FCF each year and to move slowly toward FCF positive. For 2020, we currently forecast FCF of approximately -$2.5 billion.
Netflix end of year report – January 2020
Along the way, we’ll continue to use the debt market to finance our investment needs as we did in Q4’19, when we raised $1.0 billion 4.875% senior notes and €1.1 billion 3.625% senior notes, both due in 2030.
Netflix faces increasing pressure to rely less on debt to fund its content. Yet at the end of 2019, Netflix had increased its long-term debt by over $4Bn.
Improving Cashflow
Netflix said cash burn peaked last year and it expects to achieve free cash flow positive in the future. During the fourth-quarter earnings call, Netflix CEO Reed Hastings said the positive cash flow won’t come from scaling back spending on content, but rather from increases in revenue and operating income.
Netflix International Expansion
The international segment has become bigger than the US/Canada markets. In fact, in 2019 international streaming accounted for $9.8 billion in revenues.
In Q4, we launched a mobile-only plan in Malaysia and Indonesia (which we introduced to India in Q3 last year). We’ve seen similar results with this plan driving incremental subscriber growth and improving retention.
Netflix end of year report – January 2020
However, to maintain momentum and achieve its goals, Netflix has to tackle its recent problems in the largest future market – India.
Netflix India
India’s streaming video market should expand more than ten times in the next few years. BCG estimates show that India’s streaming video market, comprising subscription and advertising sales, was worth $500 million in 2018.
CEO Reed Hastings admitted in 2019 that the company was unable to attract new users, as it lacked strong content in India.
We’re also excited to announce that we will be launching Disney+ in India through our Hotstar service on March 29 at the beginning of the Indian Premier League cricket season. We will be rebranding our existing Hotstar VIP and Premium subscription tiers to Disney+ Hotstar. We see this as a great opportunity to use the proven platform of Hotstar to launch the new Disney+ service in one of the most populous countries and fastest-growing economies in the world. … we’re going to launch bundled with Hotstar, directly bundled, meaning it’s Disney+ Hotstar as a product.
Disney CEO Bob Iger
Meanwhile, Disney’s Hotstar business leads India’s subscription streaming video market. Hotstar boasts 3.0 million paying subscribers to its video service in India, compared to 2.5 million for Amazon Prime Video and 1.2 million for Netflix.
The question then is whether Netflix needs to have a two-pronged attached for the Asia-Pacific markets – customer acquisition and acquisition of independent video streaming services.
A Netflix subscription in India starts at 199 rupees (roughly $2.80) a month for the mobile-only plan. This plan allows users to consume Netflix content on a smartphone or a tablet, but only in standard definition. The basic plan, which allows users to watch Netflix on laptops and televisions in addition to mobile devices, goes for 499 rupees ($7) a month. The full-featured plan costs 799 rupees (just over $11) a month.
On the other hand, a Hotstar subscription can be had for 999 rupees (just over $14) a year, much cheaper than Netflix’s mobile-only plan. Iger hasn’t revealed how much a Disney+ and Hotstar bundle could cost in India, but there is a lot of room for them to be price competitively.
Some of the tactics Netflix is using in India and in general:
- Netflix has created a lower-priced plan option for customers in India (mobile only).
- Improve the quality of local unique content.
- Hire the right people – Netflix recently hired Monika Shergill as head of its Indian original programming. Her previous experience includes roles at Sony (SNE) and Disney-owned Star India.
Netflix Competition
Disney Plus might be the new kid on the block, but it’s wasted no time in attracting 28.6 million paid subscribers. That’s the number according to CEO Bob Iger during the company’s first-quarter earnings call.
That may not seem like a lot when compared to Netflix’s 167 million subscribers, but to put it in context, Disney Plus has been around for less than three months, while Netflix has been streaming movies and TV shows for 12 years.
Amazon the behemoth platform which has Amazon Prime is also and is intent on acquiring market share.
How The Video Streaming Platforms Differ
| Company | Netflix | Disney | Fox, Sky | YouTube | HBO |
| Offer | Stories, unique content and entertainment | Big blockbusters and family experience | News and Sports + Entertainment | Information, education + entertainment | Niche Shows and Series |
| Business Model | Subscription | Subscription + Disney flywheel | Ads and affiliate fees | Ads/Subscription | Ads/Subscription |
With more competition in the market customer acquisition costs for established markets which are generally higher than developing, markets will be pushed up. A bigger set of competition is also likely to create a higher churn rate for Netflix as customers are tempted away from their platform.
Netflix business strategy
There is no doubt that the wheels won’t fall off Netflix and it is in a strong position. No other player in the market has the same global reach or scale. However, as with many markets, the danger is losing market share by multiple players and potential new entrants.
Improving Customer Retention
To do this, we try many approaches; in 2019 alone, we conducted hundreds of product tests to try to improve our member experience from sign up to billing and payments to content discovery. About 30% of these led to a gain in retention, engagement or revenue, up from 20% in the prior year.
Netflix end of year report – January 2020
Changing The Business Model
Over the past several years, we’ve been developing an animation studio within Netflix to produce a wide array of animated content for kids, adults and families. We have amazing creators with pedigree from Disney Animation, Pixar, DreamWorks Animation and Illumination now working at Netflix on their next big projects.
Is Netflix in danger of trying to be a Disney? This move increases fixed costs and as yet has no record of delivery. Will it substantially improve the content and enough to warrant the level of investment?
Because of these fears, Netflix has vastly underperformed the market over the last year, generating a paltry 5.3% return compared to the 20% and 27.7% returns that the S&P 500 and Nasdaq indices generated over the same period, respectively.
Summary of the Netflix Business Model
The root of the company’s big advantage over its streaming competition is its scale. Netflix’s 167 million global subscribers are delivered an annual run rate of about $22 billion per year. That has allowed Netflix to invest a heavily in content last year, with even more expected to be invested this year.
However some cautionary points:
- Acquisition cost per subscriber going up.
- Netflix needs to address the $3 billion negative cash flow.
- Improving the quality of content – consistently.
- Have a clear strategy to win in the biggest developing markets and secure the Asia Pacific market.
The international expansion is costing Netflix billion of dollars and this needs to continue as the US market growth slows and competition intensifies.
