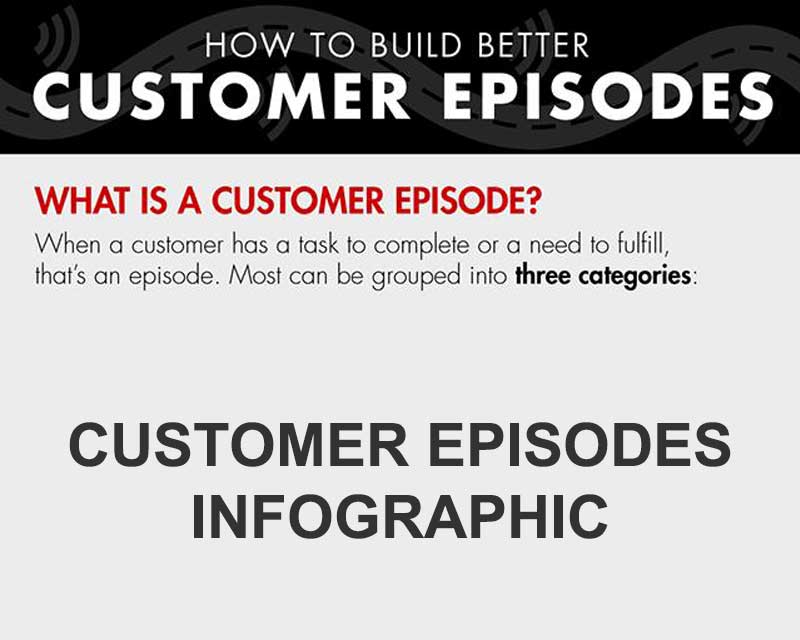
Customer Episodes Infographic. Companies are strategically focus on their customer experience capabilities.
Many executives view their customer experience as being directly related to customer service. However, the customer experience encompasses a far wider range of interactions between the organisation and the customer. earning greater loyalty requires improving individual service interactions.
The customer experience includes the products, the price or value of the products, and the company’s reputation and brand image (brand promise of quality)… The attributes that are important to each organisation will depend on the market and type of product or service.
Customer Episodes Infographic
Delivering great customer experience creates a much deeper level of loyalty, produces greater levels of customer advocacy and hence yileds greater profitable returns. The economics of loyal customers is a critical driving force for developing great customer episodes. The question is how do organisations effectively measure customer loyalty?
Measuring loyalty programme is not necessarily straightforward.
The difficulty comes from loyalty being an intention. And one that people aren’t always honest about. The benefits of loyalty are great, however.
A loyal customer is…
- Likely to refer you to her friends and contacts.
- Likely to continue buying from you as long as the need is there.
- Not actively looking for other suppliers.
- Not open to sales pitches from competitors.
- Open to other products and services that you offer.
- Easy going towards emerging issues and gives you time and trust to fix them.
- Likely to give feedback about how you could improve.
There is no magic number that you can monitor to tell you precisely how loyal customers are. Taking a range of measures allows an organisation to ‘triangulate’ the loyalty of customers.
#1 – Net Promoter Score
Organisations therefore need to measure a range of figures . The most customary measure is the Net Promoter Score (NPS). The NPS calculates measures customer loyalty based on a simple metric: the likelihood that customers will recommend the company to their friends or colleagues. NPS divides your customers into three categories:
Detractors. Customers answering with a score of 6 or lower are segmented as “Detractors”. They won’t recommend you to anyone, will probably not buy from you again, and might even hurt you through negative word-of-mouth.
Passives. Those with a 7 or 8 are segmented as “Passives”. They are quite satisfied, but not ecstatic enough to recommend you. They won’t hurt you, they aren’t looking for alternatives, and they’ll likely stick around as long as they don’t run into a supplier with a better value proposition.
Promoters. Those with a 9 or 10 fall into the “Promoters” segment. They are your groupies, your equivalent of the people camping in front of the Apple store. They’re likely to recommend you and buy from you again.
NPS TOOLS
- Trustfuel NPS (free)
- Promoter.io(paid)
- In-app tools like Wootric(freemium).
#2 – Repurchase Ratio
The repurchase ratio measures the ratio of repeat purchasers over one-time purchasers. A purchase is at the core of a commercial relationship, which makes this metric a valid representation of customer loyalty.
This metric can be easily distorted, however. If it takes a big effort to switch between providers, for example, you could have a large portion of repurchasers who would nevertheless switch if this effort would be mitigated.
#3 – Upselling Ratio
This tracks the ratio of customers who’ve bought more than one type of product divided by the customers who’ve bought only one. This sounds similar to the Repurchase Ratio, but it’s different because it concerns another product.
Buying new products is a clear indication of customer loyalty. The trust you gained through your customer’s previous experiences has reflected on your other product offerings.
#4 – Customer Loyalty Index (CLI)
This is a standardized tool to track customer loyalty over time, and it incorporates the values of NPS, repurchasing, and upselling.
It calculates all three values with an NPS-like questionnaire on a 6-point scale. 1 stands for “Definitely Yes”, 6 stands for “Definitely No”.
- How likely are you to recommend us to your friends or contacts?
- How likely are you to buy from us again in the future?
- How likely are you to try out other of our products/services?
Your total CLI is the average score of the 3 responses.
#5 – How much would you miss us?
This is an alternative to the NPS score. You ask your customers how much they’d miss you if your company would cease to exist tomorrow.
Like the NPS, customers choose a value between 1 (would not miss at all) and 10 (I couldn’t do without you). This measures the strength of your customer connections and the perceived value of your offering.
#6 – Customer Engagement Numbers
Customer engagement is the most effective predictor of customer loyalty. Compared to NPS and CLI, customer engagement metrics are easier to measure, to influence, and that they’re more strongly correlated with revenue and profits.
Customer loyalty results out of positive interactions and experiences with your brand. These nurture emotional attachments that shield your customers from competitor influence.
Customer engagement:
- Stimulates repurchasing
- Lowers price sensitivity
- Promotes referrals
This customer episodes infographic comes from Bain & Co.


