A minute during your working week passes by without you noticing.
What can you achieve in a minute? As a moment of time, a minute may seem to be small. You may be lucky enough in a minute to grab a drink of coffee, scan your inbox or send a quick text.
However, in other situations, a minute can be an extraordinary amount of time, one in which life’s change. Imagine being a quarterback in the Superbowl in overtime, or finding yourself in a life-and-death situation in which every second count towards the outcome.
Visualizing an Internet Minute 2019
When it comes to appreciating the monumental scale of the internet, each minute presents a picture of the scale of our digital humanity and the extraordinary transformation of our world.
Today’s infographic from @LoriLewis and @OfficiallyChadd aggregates the online activity of billions of people globally, to visualise what an internet minute looks like.
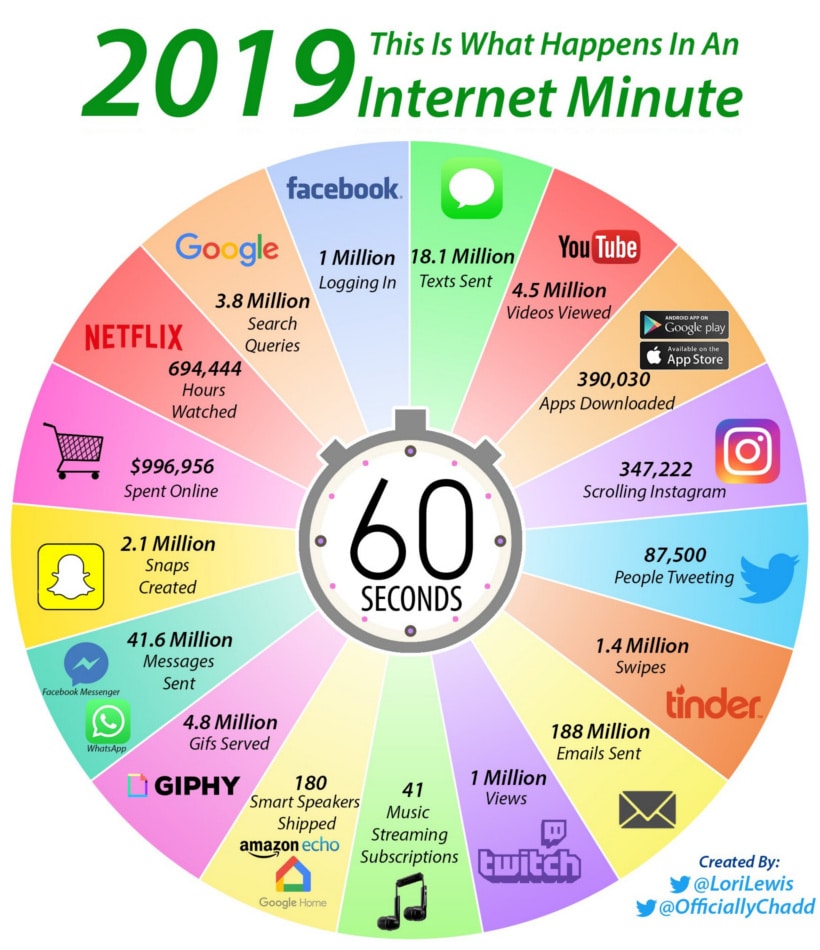
How does Google process over 3.8 million search queries in such a short span of time?
Simply put, the number of actions packed into just 60 seconds is extraordinary.
To get a better feel for the scale of social media read the post on social media statistics.
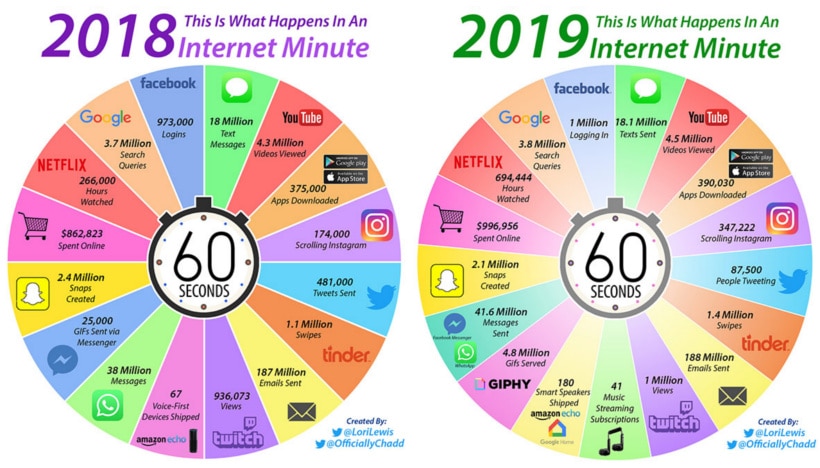
Year on Year The Changes – A Comparison 2018 to 2019
The internet is incredibly dynamic, which is shown in the infographic by the new segments that are appearing.
To get a sense of how and what is changing, compare last year’s version of this graphic with the more recent entry: