
These Facebook statistics will help you to make the right choices about how you strategically use the platform to reach, engage and acquire customers.
For some, these are just interesting factoids that titillate the mind and can later be brought out to impress friends over a coffee.
For marketers, these statistics can help in developing strategies to ensure you are targeting the audience you want to reach in the most effective way.
Facebook historical facts
Facebook was launched on February 4, 2004, by Mark Zuckerberg and his Harvard College roommates.
It was initially called Facemash, but then moved to being called Thefacebook before the final abbreviation to Facebook.
Originally the platform was only available to Harvard students. However, in March 2004, Facebook widened its audience and became available to students at the universities of Columbia, Stanford, and Yale. It then progressively and virally, reached all universities in the United States and Canada.
On September 26, 2006, Facebook was opened to everyone at least 13 years old with a valid email address
If you want to you can check out the full history of Facebook that looks at the company all the way from its origins to the modern day.

Facebook financial statistics
Net income was $5.14bn for the third quarter of 2018. The first quarter income of 2019 is down due to legal costs and other contingencies.
Facebook’s IPO raised $16 billion, making it the third largest in U.S. history.
Facebook is now the 4th most valuable brand in the world with a value of $94.8bn.
Since 2012, Facebook has acquired several companies including Instagram, WhatsApp, and Oculus. These acquisitions have cost over $22.4 billion. However, there have also been lots of acquisitions where the cost has not been undisclosed.
Facebook has 37,700 employees and rising.
Mark Zuckerberg’s salary is only $1 a year! However, his net worth is estimated at an astounding $55.6 billion.
Facebook’s revenue per user has doubled in 3 years.
Facebook user and demographics statistics
Facebook.com just dropped to the world’s third most-visited website.
According to both Alexa and SimilarWeb, YouTube just replaced Facebook as the second-most popular website, globally. (After, of course, Google.)
There are 1.56 billion daily active users and 2.38 billion monthly active users on Facebook.
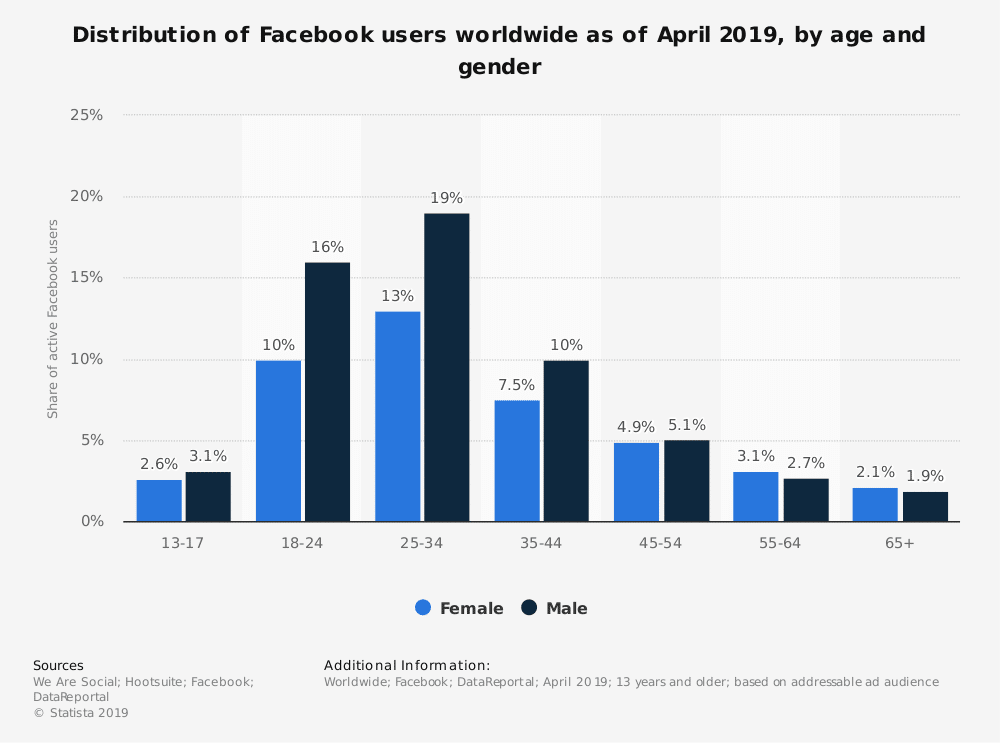
13% of global active Facebook users are women ages 25–34 – source Statista.
83% of women and 75% of men use Facebook on average.
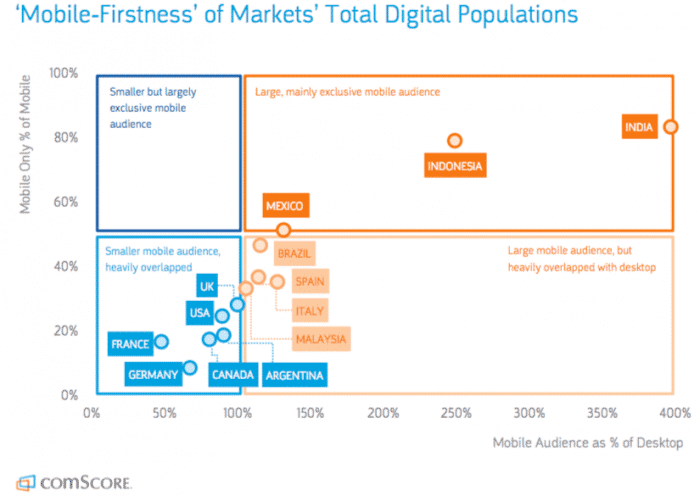
Over 1bn of those are mobile-only users.
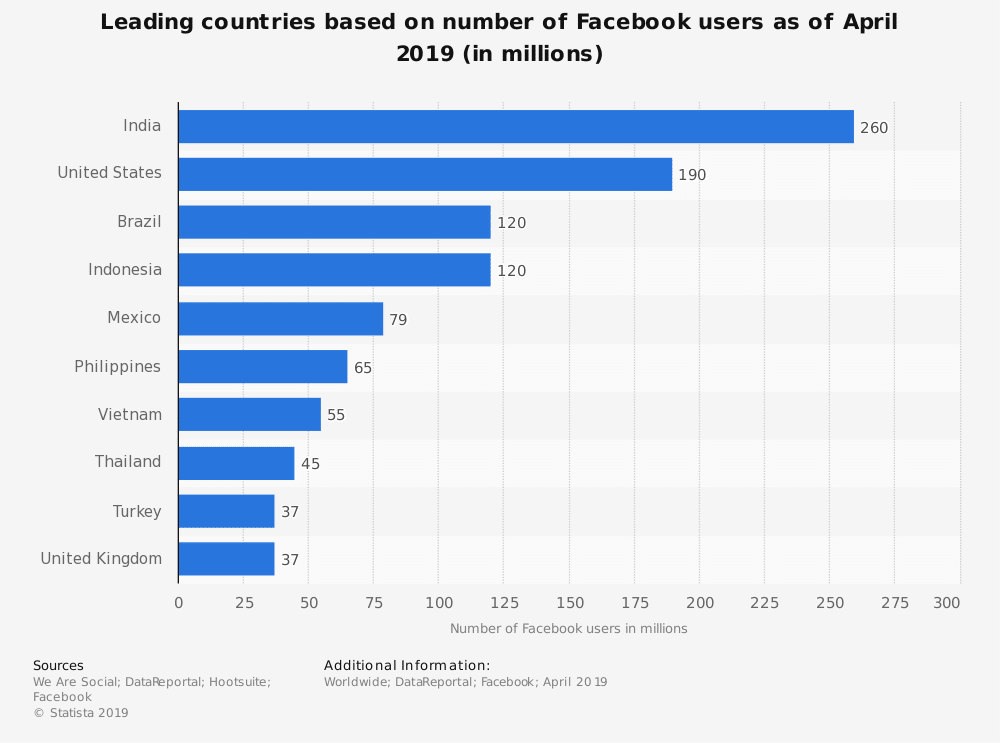
As of January 2019, the highest number is India at 300 million users. The United States is a bit further behind at 210 million users.
Facebook usually racks up more than 100 million total app downloads on a monthly basis.
Facebook Messenger is the top mobile app by number of downloads.
47% of Facebook users only access the platform through mobile.
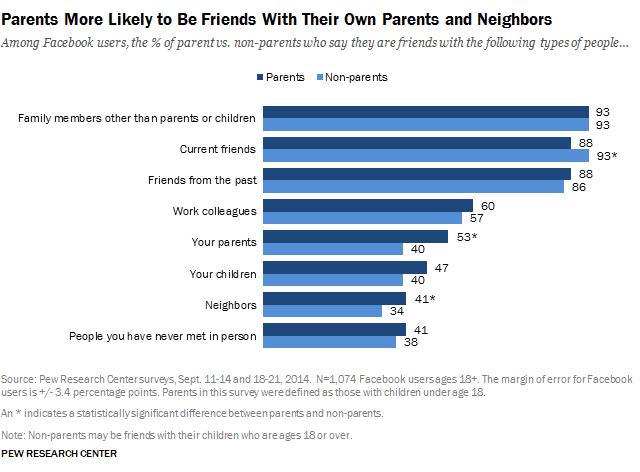
47% of parents are friends with their children on the social media platform.
Facebook adds 500,000 new users every day; 6 new profiles every second.
69% of US adults use Facebook. 51% of them use it several times a day.
Worldwide, 26.3% of the online population use Facebook.
The average (mean) number of friends is 155.
Half of internet users who do not use Facebook themselves live with someone who does.
Of those, 24% say that they look at posts or photos on that person’s account.
Facebook usage statistics
There are an estimated 81 million fake Facebook profiles.
Facebook accounts for over 42 percent of monthly social media visits.
Facebook Gets Over 8 Billion Average Daily Video Views.
85% of Facebook users watch videos with the sound off.
80% of users are annoyed when videos auto-play sound, and it gives them a negative impression of your brand.
350 Million photos are uploaded every day, with 14.58 million photo uploads per hour, 243,000 photo uploads per minute, and 4,000 photo uploads per second.
20% of videos are Live Broadcasts.
5 billion comments are left on Facebook pages monthly.
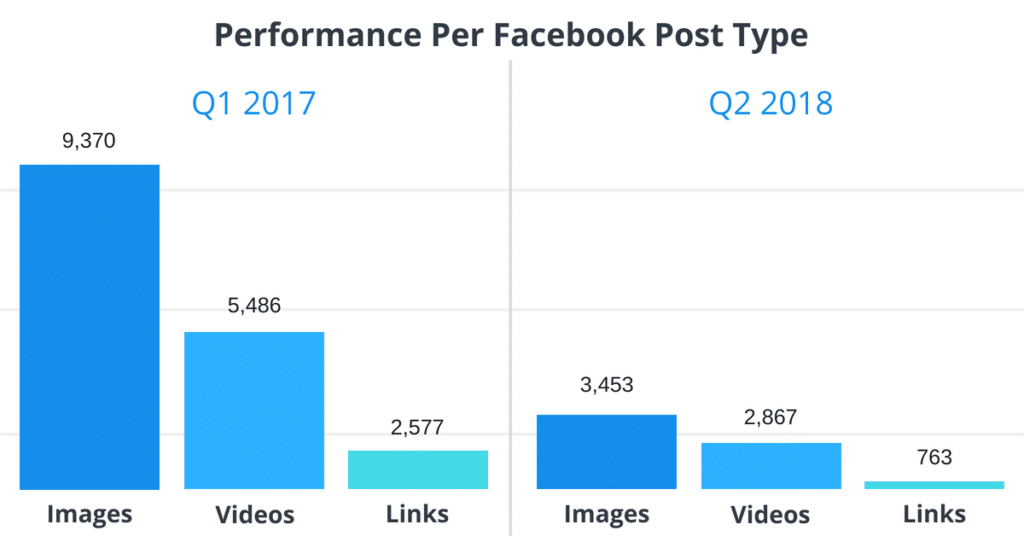
Engagement levels across the board are falling – see chart.
In Q2 2018, the top 20,000 Facebook pages were publishing an average of 135 posts per month, which amounts to just over four per day.
The most popular page is the Facebook’s main page with 213m likes. Samsung are second with 159m, while Cristiano Ronaldo is third with 122m.
Facebook accounts for 62% of social logins made by consumers to sign into the apps and websites of publishers and brands.
200 million people use Facebook Lite – the app for the developing world’s slow connections.
Facebook takes up 22% of the internet time Americans spend on mobile devices, compared with 11% on Google search and YouTube combined.
Users spend an average of 20 minutes per day on the site.
In a month, the average user likes 10 posts, makes 4 comments, and clicks on 8 ads.
Hive is Facebook’s data warehouse, with 300 petabytes of data.
Facebook generates 4 new petabytes of data per day.
Facebook now sees 100 million hours of daily video watch time.
Users generate 4 million likes every minute.
More than 250 billion photos have been uploaded to Facebook.
This equates to 350 million photos per day.
Facebook marketing statistics
Facebook has over 7M advertisers.

There are over 60 million active business Pages.
Today there are more than 80 million Business Pages on Facebook with a staggering 41% of all small businesses across the globe having a presence on the platform.
Over 2bn people can be reached through Facebook ads.
But only 6 million of those businesses pay to be ‘active advertisers’.
Although 75% of brands will pay to promote posts.
Facebook claimed 19% of the $70 billion spent on mobile advertising worldwide in 2015.
Facebook Pages posts average 2.6% organic reach.
Facebook Pages with smaller followings generally have higher reach and engagement rates.
78% of Facebook advertising revenue comes from mobile ads.
Average advert click through rate on Facebook is 0.9%.
Although adding a CTA button can lift click-through-rate by 2.85 times.
In 2018, Facebook’s average advertising revenue per user was US$11.96.
49% of users like a Facebook page to support a brand they like.
40% of users don’t like any brand pages – meaning paid adverts are the only way to reach them.
Videos earn the highest rate of engagement, despite only making up 3% of content.
Mobile advertising represents 80% of Facebook’s advertising revenue.
Posts published on Thursday and Friday receive the highest engagement.
Facebook Statistics Infographic


