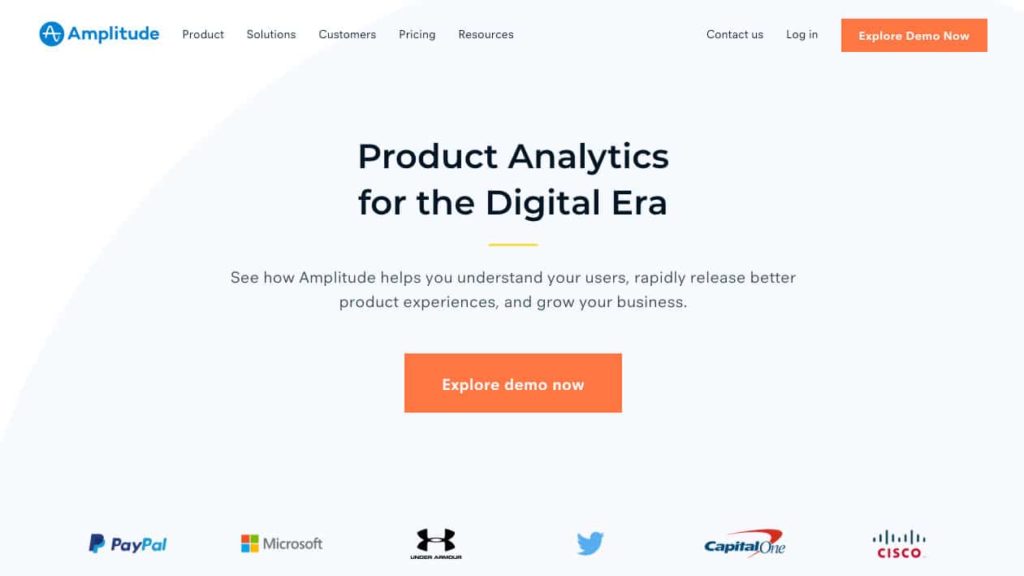
Amplitude analytics is one of the best platforms you can use to understand feature adoption, real-time performance, track funnels and understand user behaviours.
Table of Contents
What is Amplitude?
Using Amplitude you can track any event and connect that to a user. Amplitude allows you to filter by any data point and move your data around to turn it into multiple types of charts: funnels, event hits, revenue, etc.
Each time you make changes you want to be able to see the impact of those changes. In this way you want to have a tool that naturally fits into your workflow and helps you evolve your product.
Some of the key features of Amplitude Analytics:
- Customized reporting – configure reports the way you want to see your data
- Funnels: It’s easy to set up custom funnels. These can be created retrospectively as well which makes it very powerful as it doesn’t require you to create any predefined goals.
- User/Session: Amplitude provides this data for mobile where sessions are way easier to be defined (app open/close).
- Merging Events/Linking Events: Amplitude enables you to merge event names and link them together. You can easily change your old event names to something new and still connect the data together.
- Segments/Cohorts: You can easily set up and track cohorts and segments.
- Dashboarding/Charts: You can create dozens of different charts and add them to any dashboard. The dashboards will then, for example, give you the ability to change the date range.
- A/B Testing – Significance Calculator: Are you running an A/B test on your site and sending the data to Amplitude. In charts, you can see the significance calculation from the results immediately which saves a lot of time.
- Retroactive reporting: You can set up a goal funnel really easily with old data and have all the old data available to analyse.
- Real-time: Amplitude processes in real time. After launching a new feature you can analyze the data to see what’s going on straight-away. Gone are the days when you needed to wait for hours to have the data available.
- Unlimited event/user properties & ‘dimensions’: Every event can have properties that can be related to the event. In addition to that, a user can have properties that can be used too.
- CLTV: Measuring the lifetime value of users enables you to understand how users are performing over time and if you are improving your retention. As an example, you can easily run a report on a segment of users understand they’re worth to the business.
Because of these features, Amplitude is a reporting tool and what I refer to as an insights tool. It gives product teams easy access to insightful, actionable data, without the need to run any complex sql queries. The straight forward event tracking provides lots of flexibility for manipulating the data, with plenty of out of the box charts.
I would encourage you to read their Product Analytics Playbook. It is an excellent overview of content marketing. It’s not just the usual gush of known tips, it gives a framework for developing a retention strategy with data.
Try Amplitude
Get the insights to drive growth in your business
