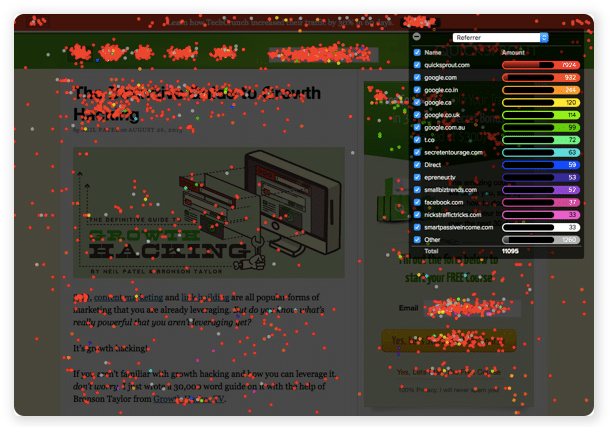
Crazy Egg tracks how your visitors interact with your site. It uses mouse-tracking technology so you can get a visual representation of:
- Which parts of your page your users click on the most.
- Where your visitors came from.
- Which elements of your page your visitors are reading and interacting with the most.
- Which parts of your page are being ignored.
There are other tools that offer heat mapping but none seem to have the same range of features as Crazyegg. They focus on heatmapping and heatmapping alone.
The heatmap is where you can get a visual of where and what people are clicking on. Areas that get most clicks are referred to as“hotspots and are shown in red. Using this feature, you can quickly find popular areas on your web pages. Conversely, you get to quickly spot the areas that need improvement.

As an example, if you have some critical call-to-action buttons on your website but they are not red, then you know you have a problem!
How Does a Heatmap Tool Measure Attention?
A heatmap tool analyses the parts of your web page that people interact with and turns this into a visual. It essentially measures the level of attention by grabbing the HTML of your page.
For example, your page probably has a number of menu links at the top, clickable elements within the content, a call to action (CTA) button, and links in the footer. Every time somebody clicks on one of those elements, the tool records those clicks.
The elements that receive the most engagements get the brightest colours on the heatmap.
Crazy Egg claims it’s “like a pair of x-ray glasses that lets you see exactly what people are doing on your website.” It does that with more than just heatmaps, though. It also uses recordings.
In other words, you can watch a video of how people interact with your website. That will tell you quite a bit about where visitors are focusing their attention.
Crazy Egg also supports split-testing. That will help you understand how changes to the user interface impact visitor behaviour.
